
MATLAB: An Introduction with Applications
6th Edition
ISBN: 9781119256830
Author: Amos Gilat
Publisher: John Wiley & Sons Inc
expand_more
expand_more
format_list_bulleted
Related questions
Question
1A. State the null and research hypothesis
2A. Make a decision based on the information provided
3A. State the type of error that may exist under the condition.
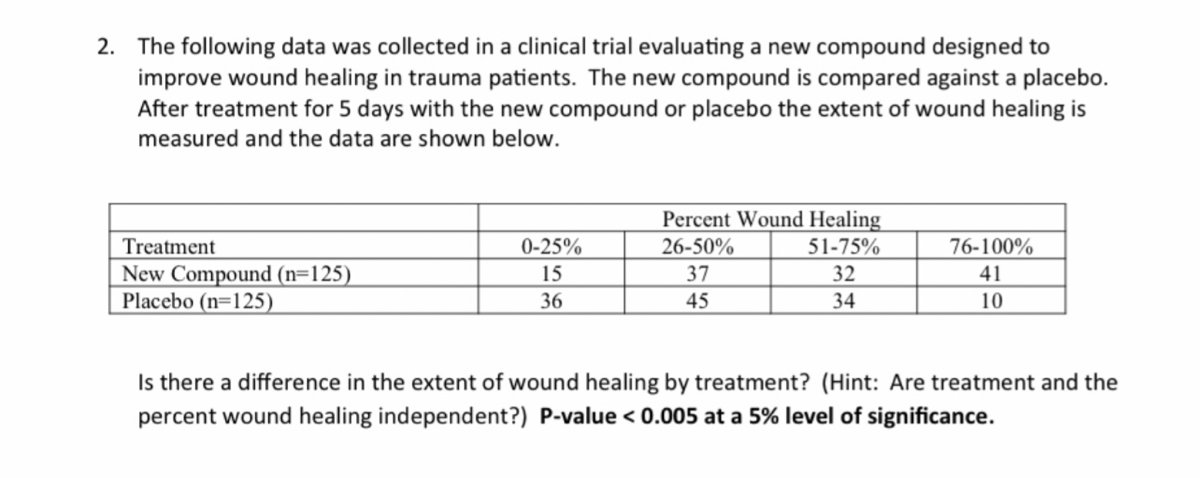

Transcribed Image Text:2. The following data was collected in a clinical trial evaluating a new compound designed to
improve wound healing in trauma patients. The new compound is compared against a placebo.
After treatment for 5 days with the new compound or placebo the extent of wound healing is
measured and the data are shown below.
Percent Wound Healing
Treatment
0-25%
26-50%
51-75%
76-100%
New Compound (n=125)
Placebo (n=125)
15
37
32
41
36
45
34
10
Is there a difference in the extent of wound healing by treatment? (Hint: Are treatment and the
percent wound healing independent?) P-value < 0.005 at a 5% level of significance.
Expert Solution
This question has been solved!
Explore an expertly crafted, step-by-step solution for a thorough understanding of key concepts.

This is a popular solution

Trending nowThis is a popular solution!

Step by stepSolved in 3 steps

Knowledge Booster


Learn more about
Need a deep-dive on the concept behind this application? Look no further. Learn more about this topic, statistics and related others by exploring similar questions and additional content below.Similar questions
- 20. Which of the following is a null hypothesis? a. Pregnant women who drink cranberry juice will have lower urine bacterial counts than those who do not drink cranberry juice. b. The urine bacterial count of pregnant women who drink cranberry juice will be lower or equal to that of pregnant women who do not drink the juice. c. There will be a difference between ingestion of cranberry juice and among pregnant women who do and do not have high urine bacterial counts.arrow_forwarda) Interpret the coefficient on pfmeals in Model 2 (mathematically and statistically). b) is the coefficient on pfmeals in Model 1 biased compared to the coefficient on pfmeals in Model 2. If so, by how much? c) What 2 conditions would need to be true for bias of pfmeals to exist? Use only the information from Models 1 and 2 above to answer this question.arrow_forwardAccepting a true Alternate Hypothesis is Select one: a. Type I error b. Type II error c. both of these d. none of these Clear my choicearrow_forward
- 6. A cigarette manufacturer has designed a new filter for the filtered cigarettes it produces. The following hypotheses are being tested: Ho: the new filter is effective in reducing tar H₁: the new filter is not effective in reducing tar Would concluding that the new filter is effective in reducing tar when it actually is not effecuve be an example of a Type 1 or Type 2 error? Would this be a serious error to make? Explain.arrow_forwardI need help with this pleasearrow_forward16)arrow_forward
- 4. The decision-making process A graduate student believes that people consider faces with more contrast between lip color and skin tone as more feminine. She identifies the null and alternative hypotheses as: Ho: The level of contrast between lip color and skin tone does not affect how feminine a face is considered. H1: The level of contrast between lip color and skin tone affects how feminine a face is considered. She chooses a significance level of 0.01. After she collects the data and computes the sample statistics, it is time for her to make a decision about Ho. Check the two possible decisions that the graduate student can make given her choices of Ho and H1. Check all that apply. O There is not enough evidence to reject the hypothesis that the contrast between lip color and skin tone does not affect how feminine a face is considered. O There is not enough evidence to reject the hypothesis that the contrast between lip color and skin tone affects how feminine a face is…arrow_forwardA company manufacturing CDs is working on a new technology. A random sample of 717 Internet users were asked "As you may know, some CDs are being manufactured so that you can only make one copy of the CD after you purchase it. Would you buy a CD with this technology, or would you refuse to buy it even ifit was one you would normaly buy?" Of hose usert, 56% responded that they would buy the CD. Complete parts a and b below a) Create a 90% confidence interval for this percentage 口口 (Round to three decimal places as needed, Use ascending order.)arrow_forward
arrow_back_ios
arrow_forward_ios
Recommended textbooks for you
- MATLAB: An Introduction with ApplicationsStatisticsISBN:9781119256830Author:Amos GilatPublisher:John Wiley & Sons Inc
 Probability and Statistics for Engineering and th...StatisticsISBN:9781305251809Author:Jay L. DevorePublisher:Cengage Learning
 Statistics for The Behavioral Sciences (MindTap C...StatisticsISBN:9781305504912Author:Frederick J Gravetter, Larry B. WallnauPublisher:Cengage Learning
  Elementary Statistics: Picturing the World (7th E...StatisticsISBN:9780134683416Author:Ron Larson, Betsy FarberPublisher:PEARSON
 The Basic Practice of StatisticsStatisticsISBN:9781319042578Author:David S. Moore, William I. Notz, Michael A. FlignerPublisher:W. H. Freeman
 Introduction to the Practice of StatisticsStatisticsISBN:9781319013387Author:David S. Moore, George P. McCabe, Bruce A. CraigPublisher:W. H. Freeman
MATLAB: An Introduction with Applications
Statistics
ISBN:9781119256830
Author:Amos Gilat
Publisher:John Wiley & Sons Inc
Probability and Statistics for Engineering and th...
Statistics
ISBN:9781305251809
Author:Jay L. Devore
Publisher:Cengage Learning
Statistics for The Behavioral Sciences (MindTap C...
Statistics
ISBN:9781305504912
Author:Frederick J Gravetter, Larry B. Wallnau
Publisher:Cengage Learning
Elementary Statistics: Picturing the World (7th E...
Statistics
ISBN:9780134683416
Author:Ron Larson, Betsy Farber
Publisher:PEARSON
The Basic Practice of Statistics
Statistics
ISBN:9781319042578
Author:David S. Moore, William I. Notz, Michael A. Fligner
Publisher:W. H. Freeman
Introduction to the Practice of Statistics
Statistics
ISBN:9781319013387
Author:David S. Moore, George P. McCabe, Bruce A. Craig
Publisher:W. H. Freeman