MATLAB: An Introduction with Applications
6th Edition
ISBN: 9781119256830
Author: Amos Gilat
Publisher: John Wiley & Sons Inc
expand_more
expand_more
format_list_bulleted
Question

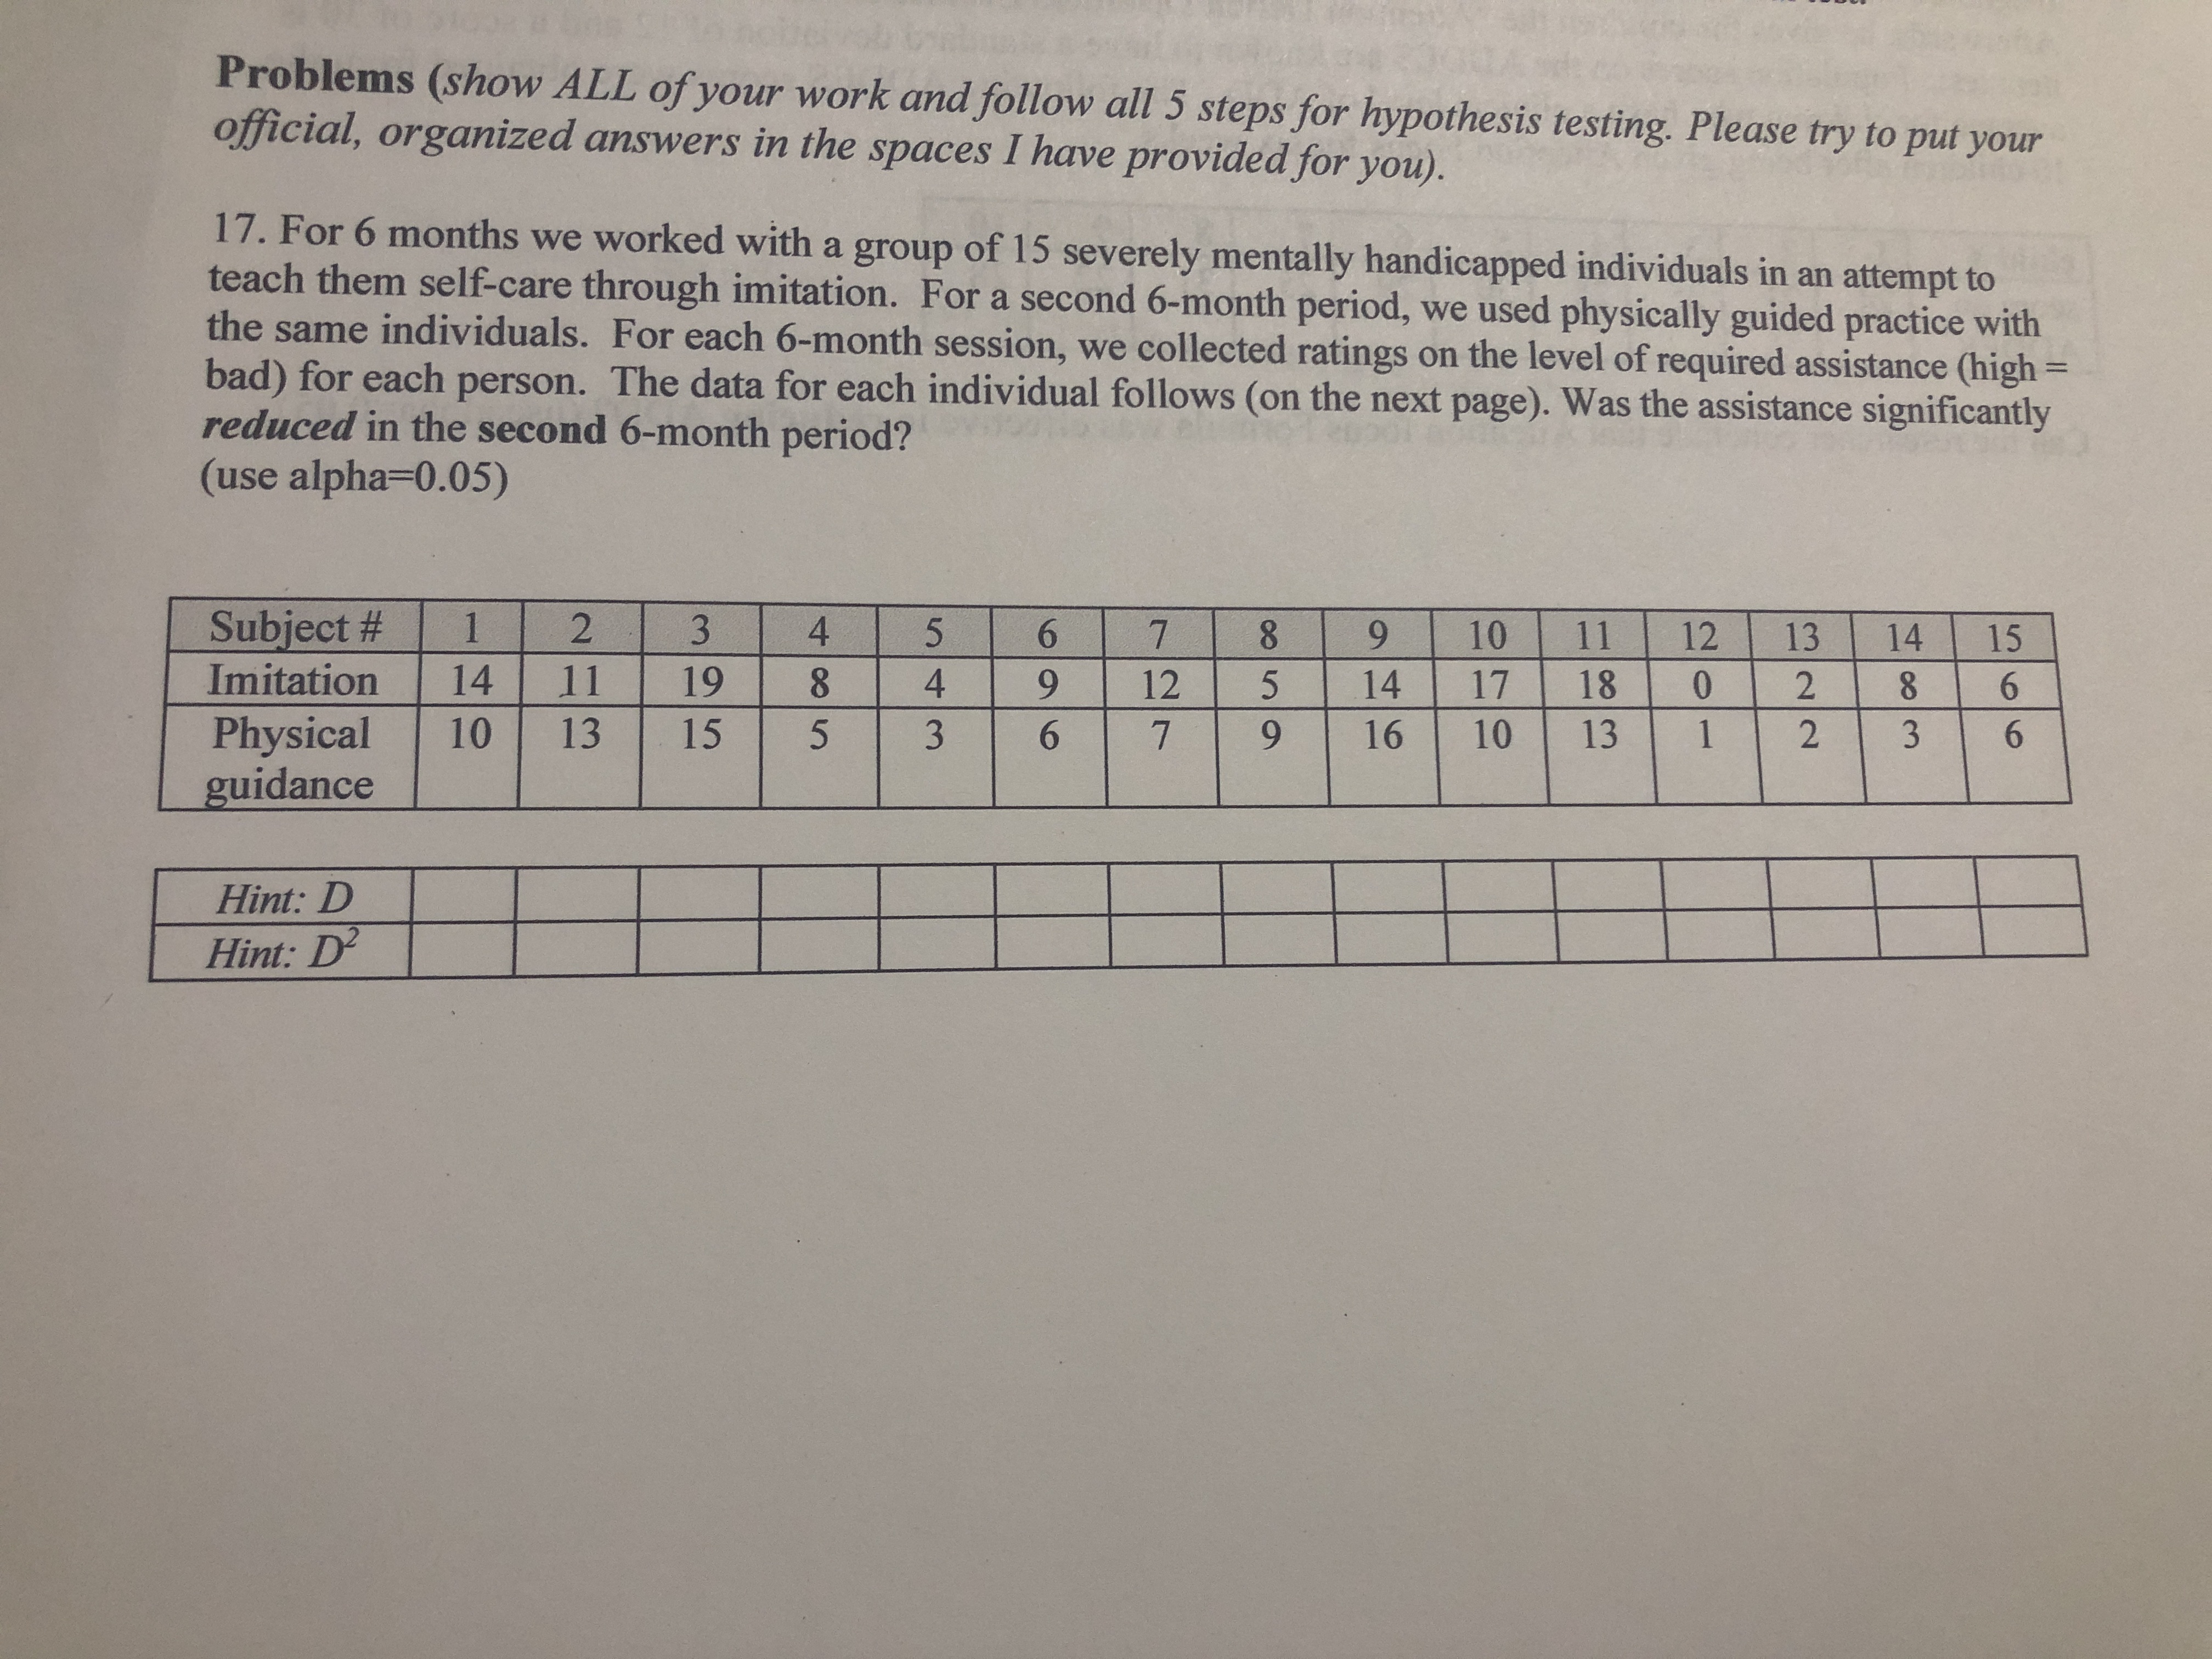
Transcribed Image Text:Problems (show ALL of your work and follow all 5 steps for hypothesis testing. Please try to put your
official, organized answers in the spaces I have provided for you).
17. For 6 months we worked with a group of 15 severely mentally handicapped individuals in an attempt to
teach them self-care through imitation. For a second 6-month period, we used physically guided practice with
the same individuals. For each 6-month session, we collected ratings on the level of required assistance (high =
bad) for each person. The data for each individual follows (on the next page). Was the assistance significantly
reduced in the second 6-month period?
(use alpha=0.05)
%3D
Subject #
Imitation
1
3
4.
6.
7.
8.
9.
10
11
12
13
14
15
14
11
19
8.
4
6.
12
14
17
18
0.
8.
6.
Physical
guidance
10
13
15
6.
9.
16
10
13
1
6.
Hint: D
Hint: D

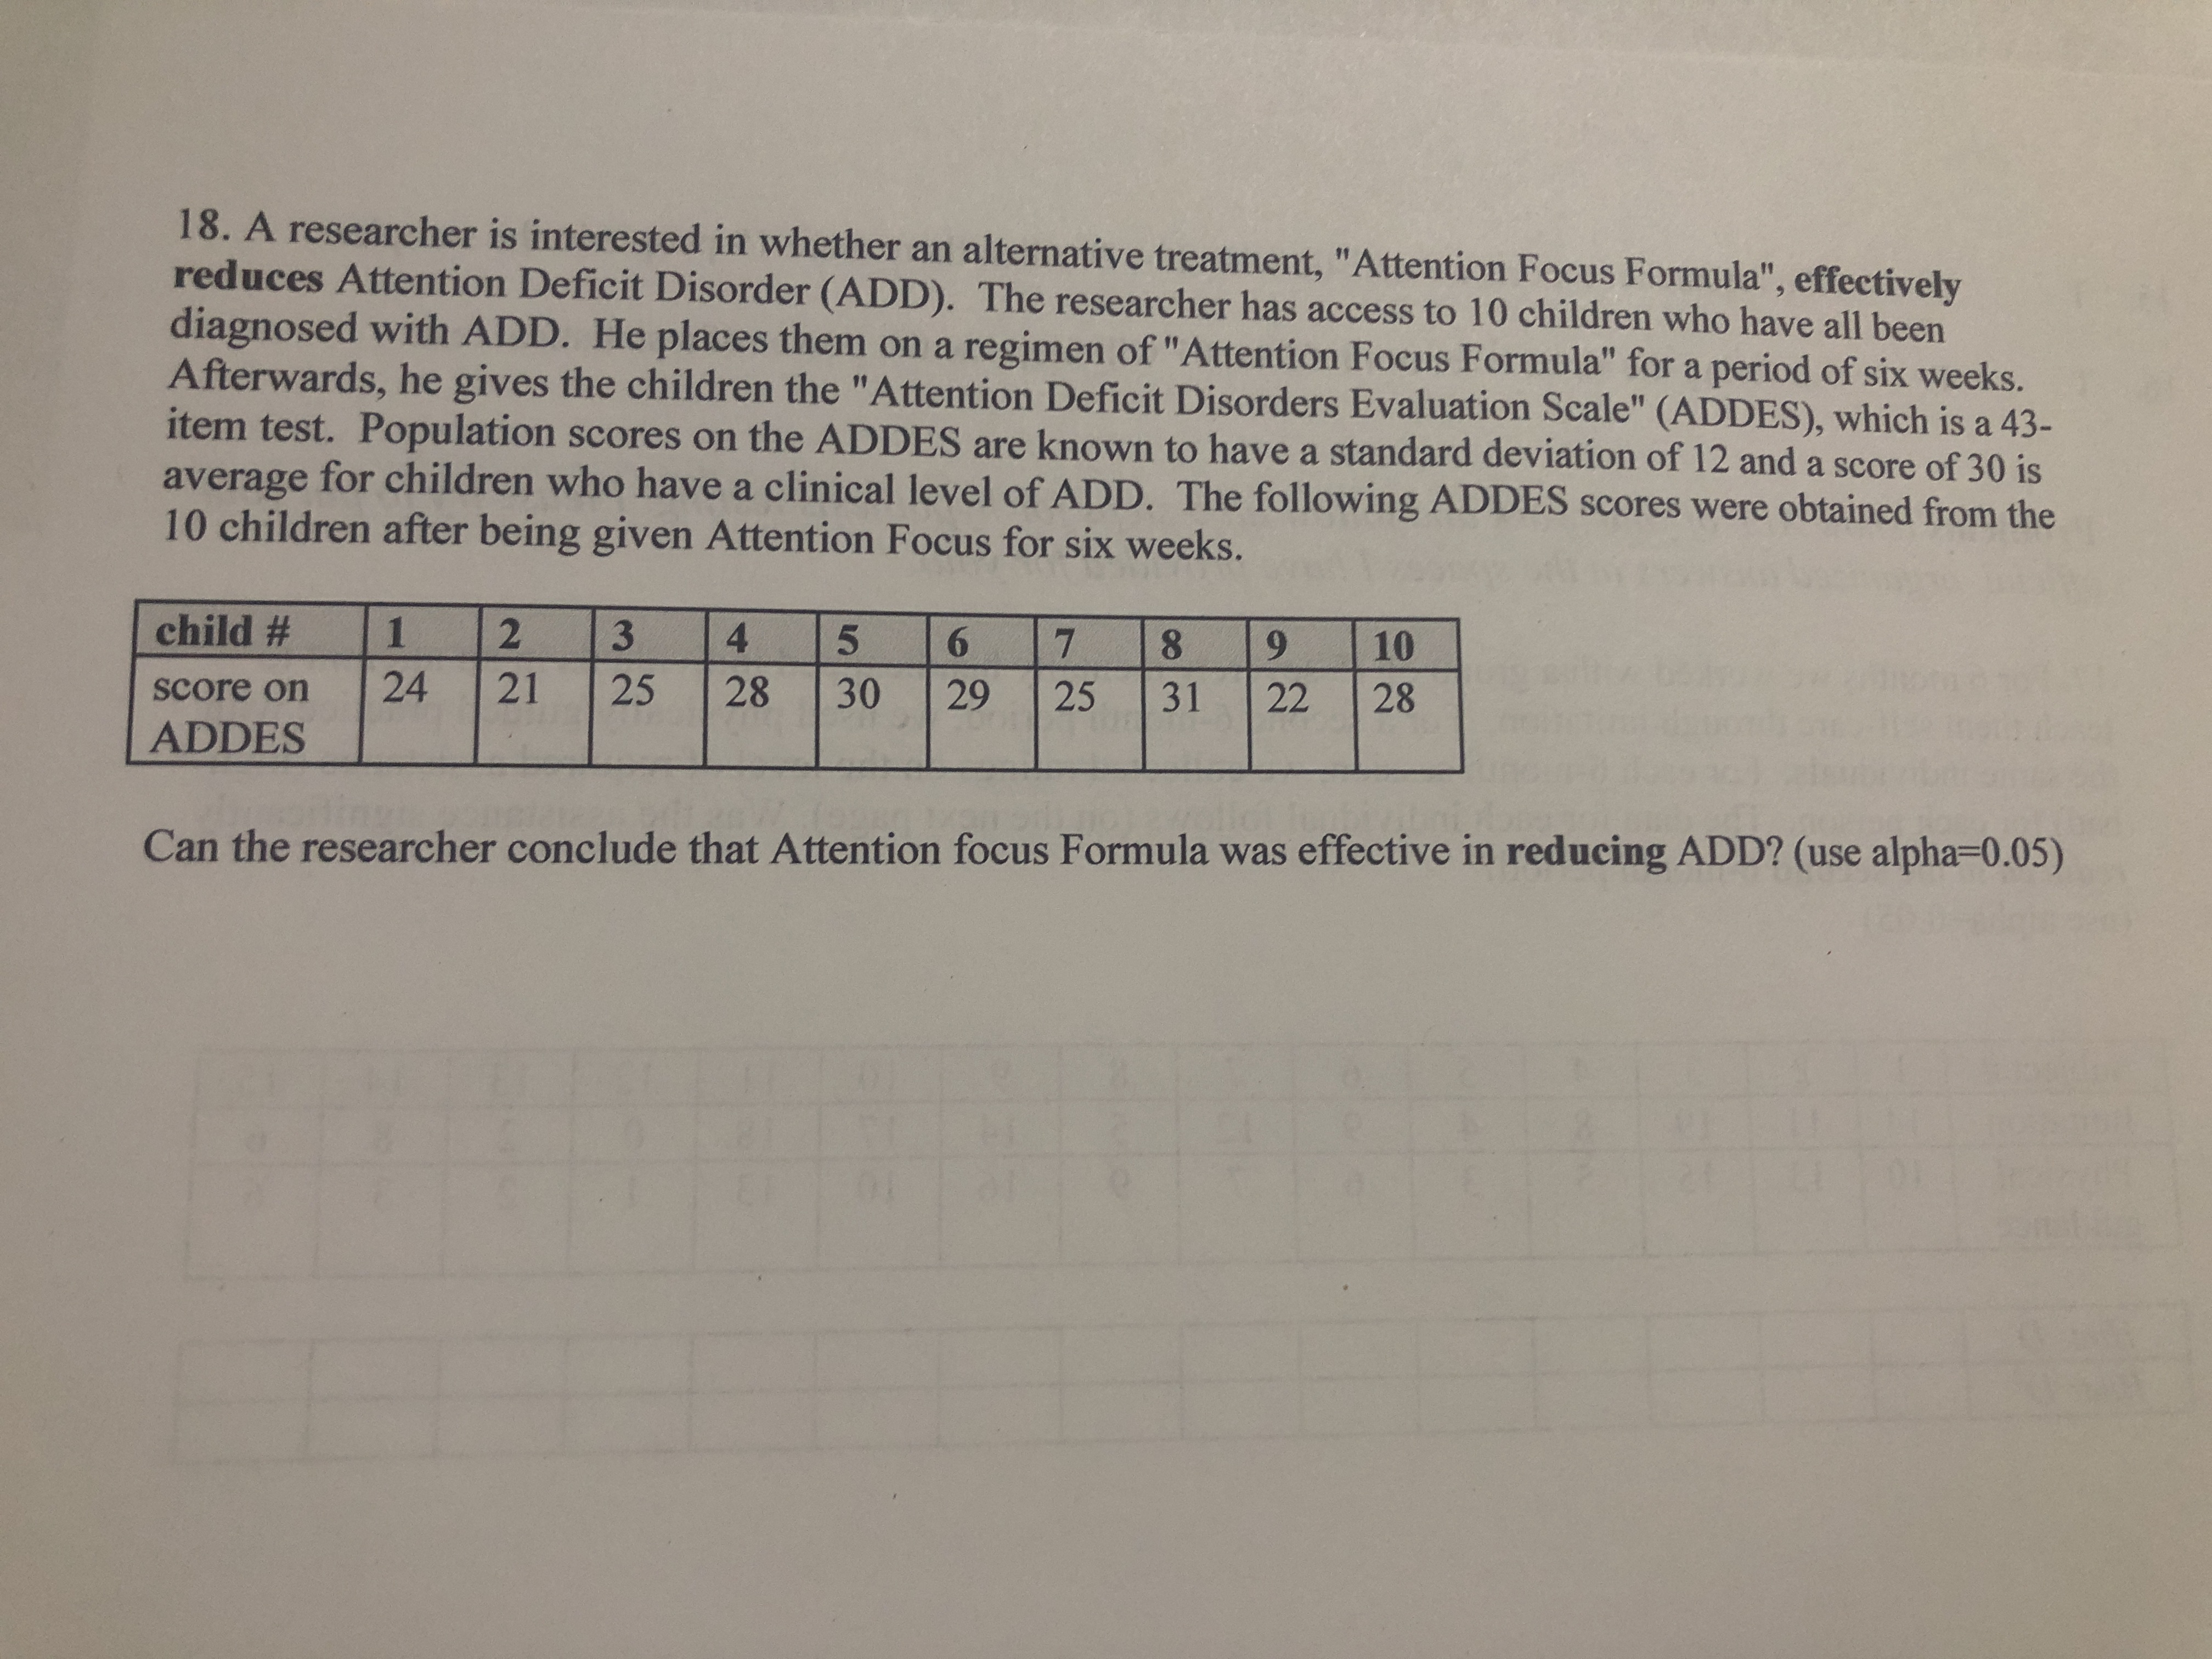
Transcribed Image Text:18. A researcher is interested in whether an alternative treatment, "Attention Focus Formula", effectively
reduces Attention Deficit Disorder (ADD). The researcher has access to 10 children who have all been
diagnosed with ADD. He places them on a regimen of"Attention Focus Formula" for a period of six weeks.
Afterwards, he gives the children the "Attention Deficit Disorders Evaluation Scale" (ADDES), which is a 43-
item test. Population scores on the ADDES are known to have a standard deviation of 12 and a score of 30 is
average for children who have a clinical level of ADD. The following ADDES scores were obtained from the
10 children after being given Attention Focus for six weeks.
child #
4.
7.
8.
6.
10
score on
24
21
25
28
30
29
25
31
22
28
ADDES
Can the researcher conclude that Attention focus Formula was effective in reducing ADD? (use alpha=D0.05)
Expert Solution
This question has been solved!
Explore an expertly crafted, step-by-step solution for a thorough understanding of key concepts.
This is a popular solution
Trending nowThis is a popular solution!
Step by stepSolved in 5 steps with 3 images

Knowledge Booster
Similar questions
- 1.arrow_forwardA psychologist wanted to know if students in her class were more likely to cheat if they were low achievers. She divided her 60 students into three groups (low, middle, and high) based on their mean exam score on the previous three tests. She then asked them to rate how likely they were to cheat on an exam if the opportunity presented itself with a very limited chance for consequences. The students rated their desire to cheat on a scale ranging from 1-100, with lower numbers indicating less desire to cheat. Before opening the data, what would you hypothesize about this research question? Open the data set. Before running any statistical analyses, glance through the data. Do you think that your hypothesis will be supported? Conduct descriptive analyses and report them here. Conduct a one-way ANOVA. Report your statistical findings (including any applicable tables in APA format) here. What would you conclude from this analysis? What would be your next steps, if this…arrow_forwardboth questions (a) and (b) pleasee Twelve inmates in a particular prison took part in an anger management class. Before it began, the median score on an anger control assessment of the group was 42 (out of a maximum of 60). After the six month class, the participants scores on the same assessment were 35, 41, 40, 44, 57, 36, 39, 47, 58, 39, 42, 39. (a) - the course was designed to lower anger control scores. Perform a sign test on whether the course was successful using a = 0.05 (b) Construct a boxplot of the data and explain briefly why a sign test is appropriate to use in this casearrow_forward
- You want to compare males and females in their use of coping strategies when engaged in conflict in relationships. You send surveys to couples obtained from marriage license application at the county clerk's office. You identify several distinct coping strategies on the survey and have the respondents rate their use of each strategy on a 7-point scale. You then compare scores that come from the two members of each relationship. If testing hypotheses about the effects of gender on use of coping strategies, it would be most appropriate to calculate a ... 1) independent-samples t 2) one sample t 3) paired samples t 4) z testarrow_forwardThe leader of two postpartum women’s support groups is interested in the depression levels of the women in her groups. She administers the Center for Epidemiologic Studies Depression Scale (CES-D) screening test to the members of her groups. The CES-D is a 20-question self-test that measures depressive feelings and behaviors during the previous week. The mean depression level from the screening test for the 10 women in the first group is μ₁ = 16; the mean depression level for the 14 women in the second group is μ₂ = 10. Without calculating the weighted mean for the combined group, you know that the weighted mean is:arrow_forwardA substance abuse counselor wants to demonstrate the effect of situational stress on alcohol cravings. He recruits two groups of men who are similar in respect to history of alcohol use and demographic variables. He divides them in to two groups. In one group(n=11), the men are exposed to a stressful situation and then asked to complete a measure rating their alcohol cravings on a scale from 0-10, where 0 representsno cravings and 10 represents intense cravings. In the second group (n=10), the men are exposed to a neutral situation and asked to complete the same measure. What test and graph should I create to find out if a stressful situation result in more intense alcohol cravings than a non-stressful situation?arrow_forward
- I collected data on levels of anxiety after receiving three types of therapies (CBT, psycho education, and psycho analysis). Below are the anxiety scores for 9 patients. Is there a difference in anxiety based on treatment type ? CBT: 3, 2, 0 Psycho Education: 8, 8, 9 Psycho Analysis: 10, 12, 12 (Look at the table)arrow_forwardA researcher gathered a sample of participants who volunteered for a studying of phobias. She measured anxiety level of participants as they viewed photos of spiders and again when they viewed puppies. Which statistical test is appropriate for this study and why?arrow_forwardRead the scenario below to determine which one of the time threats to internal validity (test reactivity, instrumentation, history, and maturation) is of most concern, and provide one way to control for the threat. A researcher examines students' perception of their body image by conducting a 2-year longitudinal study of middle-school students (grades 6 - 8). Body image is measured using a scale and the same scale is measured under the same conditions at the beginning and end of the study.arrow_forward
- Prof. Flores, always interested in improving her teaching effectiveness, has decided to undertake a careful analysis of her evaluations from the past three years. A matter of special concern to her is how she is viewed by students of different majors. She's decided to look at the last question on the teacher evaluation form, Question 17, which is, "Would you recommend this professor to another student?" Each of Prof. Flores' students can be placed into one of three categories according to the student's major school, as shown in the contingency table below. (Students who have majors from more than one school are not included.) This table contains a summary of the data that Prof. Flores has collected for 500 of her students. Each of the 500 students is classified according to two variables: major school ("School of Social Science", "School of Engineering", or "School of Physical Sciences") and response to Question 17 ("No", "Maybe", or "Yes"). In the cells of the table are written the…arrow_forwardHelp please. I am extremely confused and do not understand this! Can I get help with all parts pleasearrow_forward
arrow_back_ios
arrow_forward_ios
Recommended textbooks for you
 MATLAB: An Introduction with ApplicationsStatisticsISBN:9781119256830Author:Amos GilatPublisher:John Wiley & Sons Inc
 Probability and Statistics for Engineering and th...StatisticsISBN:9781305251809Author:Jay L. DevorePublisher:Cengage Learning
 Statistics for The Behavioral Sciences (MindTap C...StatisticsISBN:9781305504912Author:Frederick J Gravetter, Larry B. WallnauPublisher:Cengage Learning
 Elementary Statistics: Picturing the World (7th E...StatisticsISBN:9780134683416Author:Ron Larson, Betsy FarberPublisher:PEARSON
 The Basic Practice of StatisticsStatisticsISBN:9781319042578Author:David S. Moore, William I. Notz, Michael A. FlignerPublisher:W. H. Freeman
 Introduction to the Practice of StatisticsStatisticsISBN:9781319013387Author:David S. Moore, George P. McCabe, Bruce A. CraigPublisher:W. H. Freeman

MATLAB: An Introduction with Applications
Statistics
ISBN:9781119256830
Author:Amos Gilat
Publisher:John Wiley & Sons Inc

Probability and Statistics for Engineering and th...
Statistics
ISBN:9781305251809
Author:Jay L. Devore
Publisher:Cengage Learning

Statistics for The Behavioral Sciences (MindTap C...
Statistics
ISBN:9781305504912
Author:Frederick J Gravetter, Larry B. Wallnau
Publisher:Cengage Learning

Elementary Statistics: Picturing the World (7th E...
Statistics
ISBN:9780134683416
Author:Ron Larson, Betsy Farber
Publisher:PEARSON

The Basic Practice of Statistics
Statistics
ISBN:9781319042578
Author:David S. Moore, William I. Notz, Michael A. Fligner
Publisher:W. H. Freeman

Introduction to the Practice of Statistics
Statistics
ISBN:9781319013387
Author:David S. Moore, George P. McCabe, Bruce A. Craig
Publisher:W. H. Freeman