
ENGR.ECONOMIC ANALYSIS
14th Edition
ISBN: 9780190931919
Author: NEWNAN
Publisher: Oxford University Press
expand_more
expand_more
format_list_bulleted
Related questions
Question

Transcribed Image Text:**Understanding Labor Demand and Market Wage Rate**
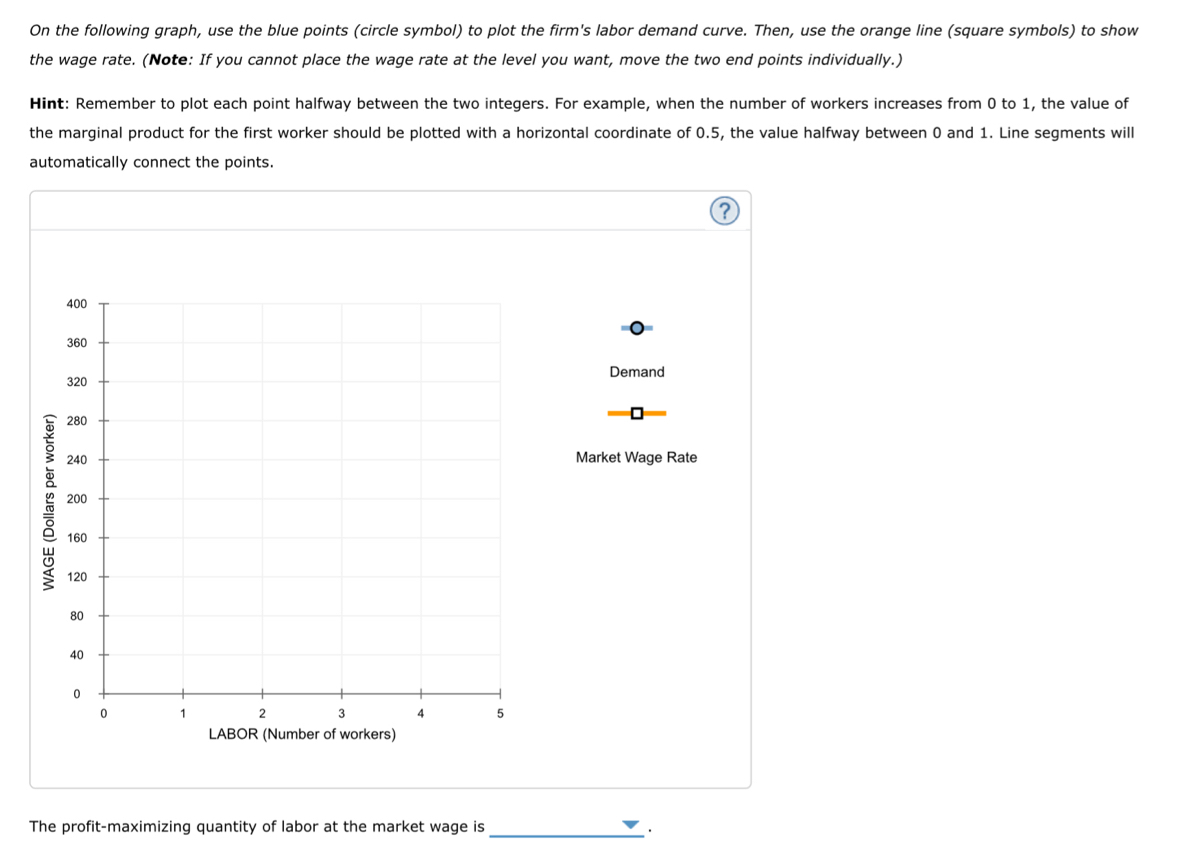
On the following graph, use the blue points (circle symbol) to plot the firm's labor demand curve. Then, use the orange line (square symbols) to show the wage rate. (*Note: If you cannot place the wage rate at the level you want, move the two end points individually.*)
**Hint:** Remember to plot each point halfway between the two integers. For example, when the number of workers increases from 0 to 1, the value of the marginal product for the first worker should be plotted with a horizontal coordinate of 0.5, the value halfway between 0 and 1. Line segments will automatically connect the points.
**Graph Explanation:**
- **X-axis:** Represents 'LABOR (Number of workers)'
- **Y-axis:** Represents 'WAGE (Dollars per worker)'
- **Legend:**
- **Demand** indicated by blue points (circle symbols)
- **Market Wage Rate** indicated by orange line (square symbols)
**Graph Illustration:**
- The graph is designed to help students understand the relationship between the number of workers (labor) and the wage rate.
- The blue circles (points) should be plotted to represent the labor demand curve at different levels of labor.
- The orange squares (line) should represent the consistent market wage rate across different numbers of workers.
Exercise: Determine the intersection of the labor demand curve and the market wage rate to find the profit-maximizing quantity of labor.
**Question:**
The profit-maximizing quantity of labor at the market wage is __________.

Transcribed Image Text:### 2. Graphing Demand for Labor and Computing the Optimal Quantity of Labor Demanded
A company operates in a competitive market, selling each unit of output for a price of $20 and paying the market wage of $270 per day for each worker it hires.
**Task:** In the following table, complete the column for the value of the marginal product of labor (VMPL) at each quantity of workers.
#### Table:
| **Labor (Number of workers)** | **Output (Units of output)** | **Marginal Product of Labor (Units of output)** | **Value of the Marginal Product of Labor (Dollars)** |
|-------------------------------|------------------------------|------------------------------------------------|---------------------------------------------------|
| 0 | 0 | - | - |
| 1 | 20 | 20 | 20 |
| 2 | 39 | 19 | 19 |
| 3 | 57 | 18 | 18 |
| 4 | 72 | 15 | 15 |
| 5 | 84 | 12 | 12 |
**Graph Details:**
On the following graph, use the blue points (circle symbol) to plot the firm's labor demand curve. Then, use the orange line (square symbol) to show the market wage.
1. **Labor Demand Curve**: Represented by blue points (circle symbols), plotting the relationship between the quantity of labor demanded and the value of the marginal product of labor.
2. **Market Wage**: Indicated by an orange line (square symbols), representing the constant market wage of $270.
Note: The graphical representations will help in visualizing how the demand for labor changes with variations in output and will aid in determining the optimal number of workers the firm should hire to maximize profit.
Expert Solution
This question has been solved!
Explore an expertly crafted, step-by-step solution for a thorough understanding of key concepts.

This is a popular solution

Trending nowThis is a popular solution!

Step by stepSolved in 2 steps with 1 images

Knowledge Booster


Learn more about
Need a deep-dive on the concept behind this application? Look no further. Learn more about this topic, economics and related others by exploring similar questions and additional content below.Similar questions
- Consider Blewitt's Farm, a small blueberry grower relative to the size of the market whose production has no impact on wages and prices. The following table presents Blewitt's production schedule for blueberries: Labor Output (Number of workers) (Pounds of blueberries) 0 WAGE (Dollars per worker) 300 270 240 210 Suppose that the market wage for blueberry pickers is $200 per worker per day, and the price of blueberries is $13 per pound. 180 On the following graph, use the blue points (circle symbol) to plot Blewitt's labor demand curve when the output price is $13 per pound. Note: Remember to plot each point between the two integers. For example, when the number of workers increases from 0 to 1, the value of the marginal product of for the first worker should be plotted with a horizontal coordinate of 0.5, the value halfway between 0 and 1. Line segments will automatically connect the points. 150 120 60 1 30 2 3 4 0 5 0 20 38 54 68 80 O Demand P = $13 Demand P = $15 (?)arrow_forwardG.186.arrow_forwardThe table below tracks the total product that results from each level of labor. Units of Labor (L) Total Product (TP) Average Product (APL) Marginal Product (MPL) 1 3 2 10 3 24 4 36 40 6. 42 7 42 40 Required: 1- Calculate average product of labor (APL) and marginal product of labor (MPL) 2- Draw only Average product of labor (APL) and marginal product (MPL) curvesarrow_forward
- 4. Graphing demand for labor and computing the optimal quantity A company operates in a perfectly competitive market, selling each unit of output for a price of $10 and paying the market wage of $130 per day for each worker it hires. In the following table, complete the column for the marginal revenue product of labor (MRPL) at each quantity of workers. Labor Output Marginal Product of Labor Marginal Revenue Product of Labor (Number of workers) (Units of output) (Units of output) (Dollars) 0 0 15 1 15 14 2 29 12 3 41 10 4 51 6 5 57 On the following graph, use the blue points (circle symbol) to plot the firm's labor demand curve. Then, use the orange line (square symbols) to show the wage rate. Line segments will automatically connect the points. (Note: If you cannot place the wage rate at the level you want, move the two end points individually.) Hint: Remember to plot each point halfway between the two integers. For example, when the number of workers increases from 0 to 1, the…arrow_forwardThe following table contains the relationship between a number of trainers working at a new gym and the number of client's they can train. These client's represent the output of trainers. Client's pay $40 per session. A. Find the marginal product of labor (mpl) and the value of the marginal product of labor (vmpl) for each additional trainer hired and record these numbers in columns in the table. B. Premier trainers earn $200 an hour. How many trainers will the gym hire?arrow_forward38) In the short run, the marginal product of labor might increase initially as more workers are hired because A) the first workers hired get to use the best equipment. B) specialization allows a worker to focus on one task, thereby increasing her proficiency at that task. c the best workers are hired first and later hires are not as skillful. Dj beyond some point, a firm has hired too many workers.arrow_forward
- Marginal revenue product of labor 56 48 $36 40 36 28 20 11 0 O 12 cake pops 36 cake pops $144 1 2 3 4 5 6 The Figure shows the marginal revenue product (also called the value of the marginal product) for Cora's Confections, a producer of hand-made cake pops. If Cora can sell her cake pops at $3 each, what is the marginal product of the 4th worker? 7 Marginal revenue product of labor Quantity of laborarrow_forwardLabor(workers per day) Total product (units per day) Marginal product Average product 0 0 0 0 1 2 2 2 2 8 3 12 4 15 5 16 1 In the above table, the marginal product is greatest when the fourth worker is hired. first worker is hired. third worker is hired. second worker is hired.arrow_forwardConsider a company operating in a competitive market. The company sells units of output and receives a price of $30 per unit, and pays a daily market wage of $285 to each worker it employs. In the following table, complete the column for the value of the marginal product of labor (VMPL) at each quantity of workers. Value of the Marginal Product of Labor Labor Output Marginal Product of Labor (Number of workers) (Units of output) (Units of output) (Dollars) WAGE (Dollars per worker) 500 450 On the following graph, use the blue points (circle symbol) to plot the firm's labor demand curve. Then, use the orange line (square symbols) to show the wage rate. (Note: If you cannot place the wage rate at the level you want, move the two end points individually.) 400 Hint: Remember to plot each point halfway between the two integers. For example, when the number of workers increases from 0 to 1, the value of the marginal product for the first worker should be plotted with a horizontal coordinate…arrow_forward
- 23) The marginal products of the first, second, and third workers are 50, 34, and 22, respectively. If four workers can produce 116 units of output, then the marginal product of the fourth worker is A) 10 B) 12 D) 116 Answer: A Diff: 2 Topic: The Production Process Skill: Analytic C) 22arrow_forwardThis table shows the number of cars the local car wash can wash in an hour depending on the number of workers employed. Number of workers 2 4 8 10 12 Total output (number of cars washed per hour) 10 26 40 50 58 62 Use this table to find the marginal product of labor for the following workers: marginal product of labor for the 2nd worker: 5 marginal product of labor for the 6th worker: marginal product of labor for the 12th worker: 5 4arrow_forward
arrow_back_ios
arrow_forward_ios
Recommended textbooks for you
 Principles of Economics (12th Edition)EconomicsISBN:9780134078779Author:Karl E. Case, Ray C. Fair, Sharon E. OsterPublisher:PEARSON
 Engineering Economy (17th Edition)EconomicsISBN:9780134870069Author:William G. Sullivan, Elin M. Wicks, C. Patrick KoellingPublisher:PEARSON
 Principles of Economics (MindTap Course List)EconomicsISBN:9781305585126Author:N. Gregory MankiwPublisher:Cengage Learning
 Managerial Economics: A Problem Solving ApproachEconomicsISBN:9781337106665Author:Luke M. Froeb, Brian T. McCann, Michael R. Ward, Mike ShorPublisher:Cengage Learning
 Managerial Economics & Business Strategy (Mcgraw-...EconomicsISBN:9781259290619Author:Michael Baye, Jeff PrincePublisher:McGraw-Hill Education
Principles of Economics (12th Edition)
Economics
ISBN:9780134078779
Author:Karl E. Case, Ray C. Fair, Sharon E. Oster
Publisher:PEARSON
Engineering Economy (17th Edition)
Economics
ISBN:9780134870069
Author:William G. Sullivan, Elin M. Wicks, C. Patrick Koelling
Publisher:PEARSON
Principles of Economics (MindTap Course List)
Economics
ISBN:9781305585126
Author:N. Gregory Mankiw
Publisher:Cengage Learning
Managerial Economics: A Problem Solving Approach
Economics
ISBN:9781337106665
Author:Luke M. Froeb, Brian T. McCann, Michael R. Ward, Mike Shor
Publisher:Cengage Learning
Managerial Economics & Business Strategy (Mcgraw-...
Economics
ISBN:9781259290619
Author:Michael Baye, Jeff Prince
Publisher:McGraw-Hill Education