
MATLAB: An Introduction with Applications
6th Edition
ISBN: 9781119256830
Author: Amos Gilat
Publisher: John Wiley & Sons Inc
expand_more
expand_more
format_list_bulleted
Related questions
Question
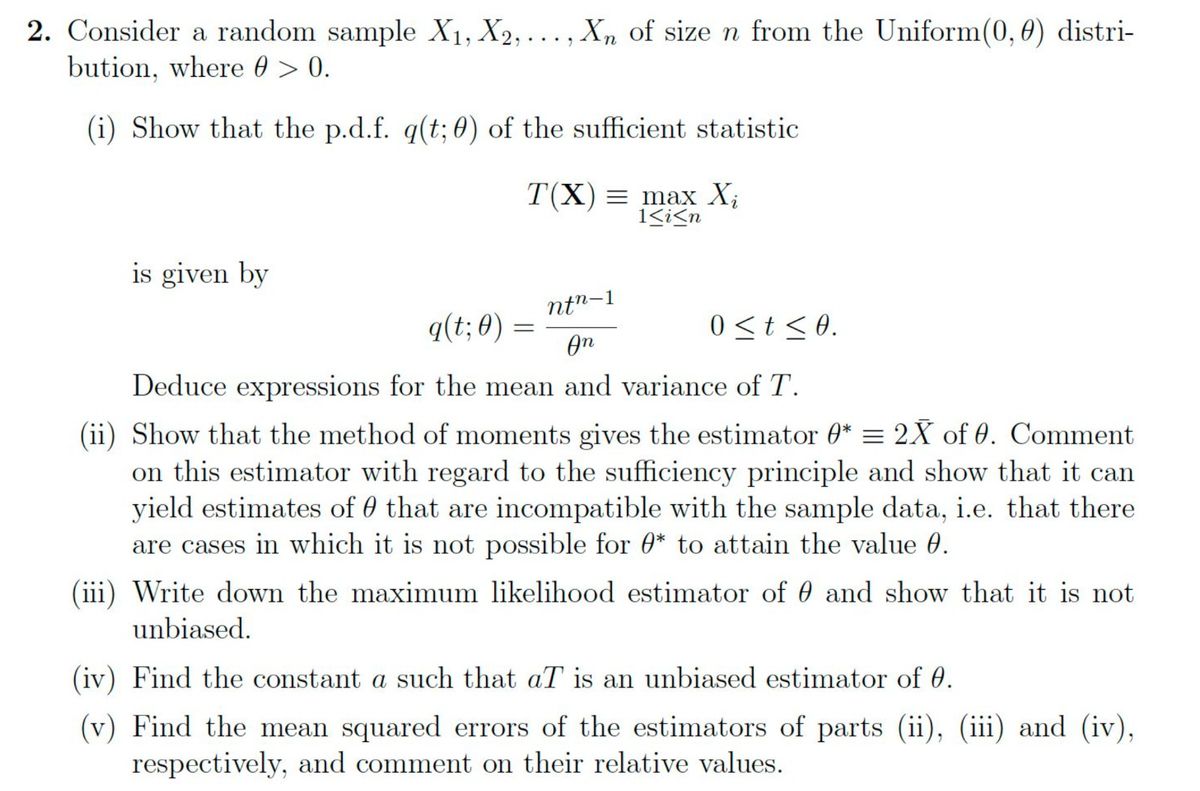

Transcribed Image Text:2. Consider a random sample X₁, X2,..., Xn of size n from the Uniform (0, 0) distri-
bution, where @ > 0.
(i) Show that the p.d.f. q(t; 0) of the sufficient statistic
is given by
T(X)= max X₁
1<i<n
ntn-1
0≤t ≤0.
An
Deduce expressions for the mean and variance of T.
(ii) Show that the method of moments gives the estimator 0* = 2X of 0. Comment
on this estimator with regard to the sufficiency principle and show that it can
yield estimates of that are incompatible with the sample data, i.e. that there
are cases in which it is not possible for * to attain the value 0.
q(t; 0) =
=
(iii) Write down the maximum likelihood estimator of and show that it is not
unbiased.
(iv) Find the constant a such that aT is an unbiased estimator of 0.
(v) Find the mean squared errors of the estimators of parts (ii), (iii) and (iv),
respectively, and comment on their relative values.
SAVE
AI-Generated Solution
info
AI-generated content may present inaccurate or offensive content that does not represent bartleby’s views.
Unlock instant AI solutions
Tap the button
to generate a solution
to generate a solution
Click the button to generate
a solution
a solution
Knowledge Booster

Similar questions
- Let X equal the number of female children in a three-child family. We shall use a chi-square goodness-of-fit statistic to test the null hypothesis that the distribution of X is b(3, 0.5) (a) Define the test statistic and critical region, using an a = 0.05 significance level. (b) Among students who were taking statistics, 52 came from families with three children. For these families, x = 0, 1, 2, and 3 for 5, 17, 24, and 6 families, respectively. Calculate the value of the test statistic and state your conclusion, considering how the sample was selected.arrow_forward= 16. A simple random sample of size n = 64 is obtained from a population with u = 77 and o = (a) Describe the sampling distribution of x. (b) What is P (x>79.5) ? (c) What is P (xs72.9)? (d) What is P (75.9 79.5) = (Round to four decimal places as needed.) (c) P (xs72.9) = (Round to four decimal places as needed.) (d) P (75.9arrow_forward3.- It has been found that the waiting time to obtain a table in a cafe during rush hour has a normal distribution with a mean of 130.7 min. and a standard deviation of 12.5 min. How long do people have to wait to be given a table with the following probability?a) P (X ≥ Xo) = 0.83.b) P (X ≥ Xo) = 0.12c) P (X ≤ Xo) = 0.92d) P (X ≤ Xo) = 0.07arrow_forward
- time, i.e. P(μx-ox ≤ x ≤ μx + 0x). 3. Suppose that people heights are normally distributed with mean of 170 cm and standard deviation of 6 cm. a) What proportion of people are between 165 cm and 175 cm tall? b) Find the minimum ceiling of an airplane such that at most 5% of people walking down the aisle will have to duck. E c) Find the probability that the average height of a random sample of 49 people is greater than 172 cm. 80 F3 4 R % 5 T F6 Y 1 & 7 K ard deviation of the expected U 8 DIIarrow_forward3) Suppose test scores are measured by the Gaussian Normal Distribution N(X,75,10) calculate the following. a) Pr(80 < X < 90) b) Pr(50 < X < 70) c) The 95 th percentilearrow_forwardattached belowarrow_forward
arrow_back_ios
arrow_forward_ios
Recommended textbooks for you
- MATLAB: An Introduction with ApplicationsStatisticsISBN:9781119256830Author:Amos GilatPublisher:John Wiley & Sons Inc
 Probability and Statistics for Engineering and th...StatisticsISBN:9781305251809Author:Jay L. DevorePublisher:Cengage Learning
 Statistics for The Behavioral Sciences (MindTap C...StatisticsISBN:9781305504912Author:Frederick J Gravetter, Larry B. WallnauPublisher:Cengage Learning
  Elementary Statistics: Picturing the World (7th E...StatisticsISBN:9780134683416Author:Ron Larson, Betsy FarberPublisher:PEARSON
 The Basic Practice of StatisticsStatisticsISBN:9781319042578Author:David S. Moore, William I. Notz, Michael A. FlignerPublisher:W. H. Freeman
 Introduction to the Practice of StatisticsStatisticsISBN:9781319013387Author:David S. Moore, George P. McCabe, Bruce A. CraigPublisher:W. H. Freeman
MATLAB: An Introduction with Applications
Statistics
ISBN:9781119256830
Author:Amos Gilat
Publisher:John Wiley & Sons Inc
Probability and Statistics for Engineering and th...
Statistics
ISBN:9781305251809
Author:Jay L. Devore
Publisher:Cengage Learning
Statistics for The Behavioral Sciences (MindTap C...
Statistics
ISBN:9781305504912
Author:Frederick J Gravetter, Larry B. Wallnau
Publisher:Cengage Learning
Elementary Statistics: Picturing the World (7th E...
Statistics
ISBN:9780134683416
Author:Ron Larson, Betsy Farber
Publisher:PEARSON
The Basic Practice of Statistics
Statistics
ISBN:9781319042578
Author:David S. Moore, William I. Notz, Michael A. Fligner
Publisher:W. H. Freeman
Introduction to the Practice of Statistics
Statistics
ISBN:9781319013387
Author:David S. Moore, George P. McCabe, Bruce A. Craig
Publisher:W. H. Freeman