
MATLAB: An Introduction with Applications
6th Edition
ISBN: 9781119256830
Author: Amos Gilat
Publisher: John Wiley & Sons Inc
expand_more
expand_more
format_list_bulleted
Related questions
Question
How to compute the sm of squares between groups with 3 treatments. #2 question
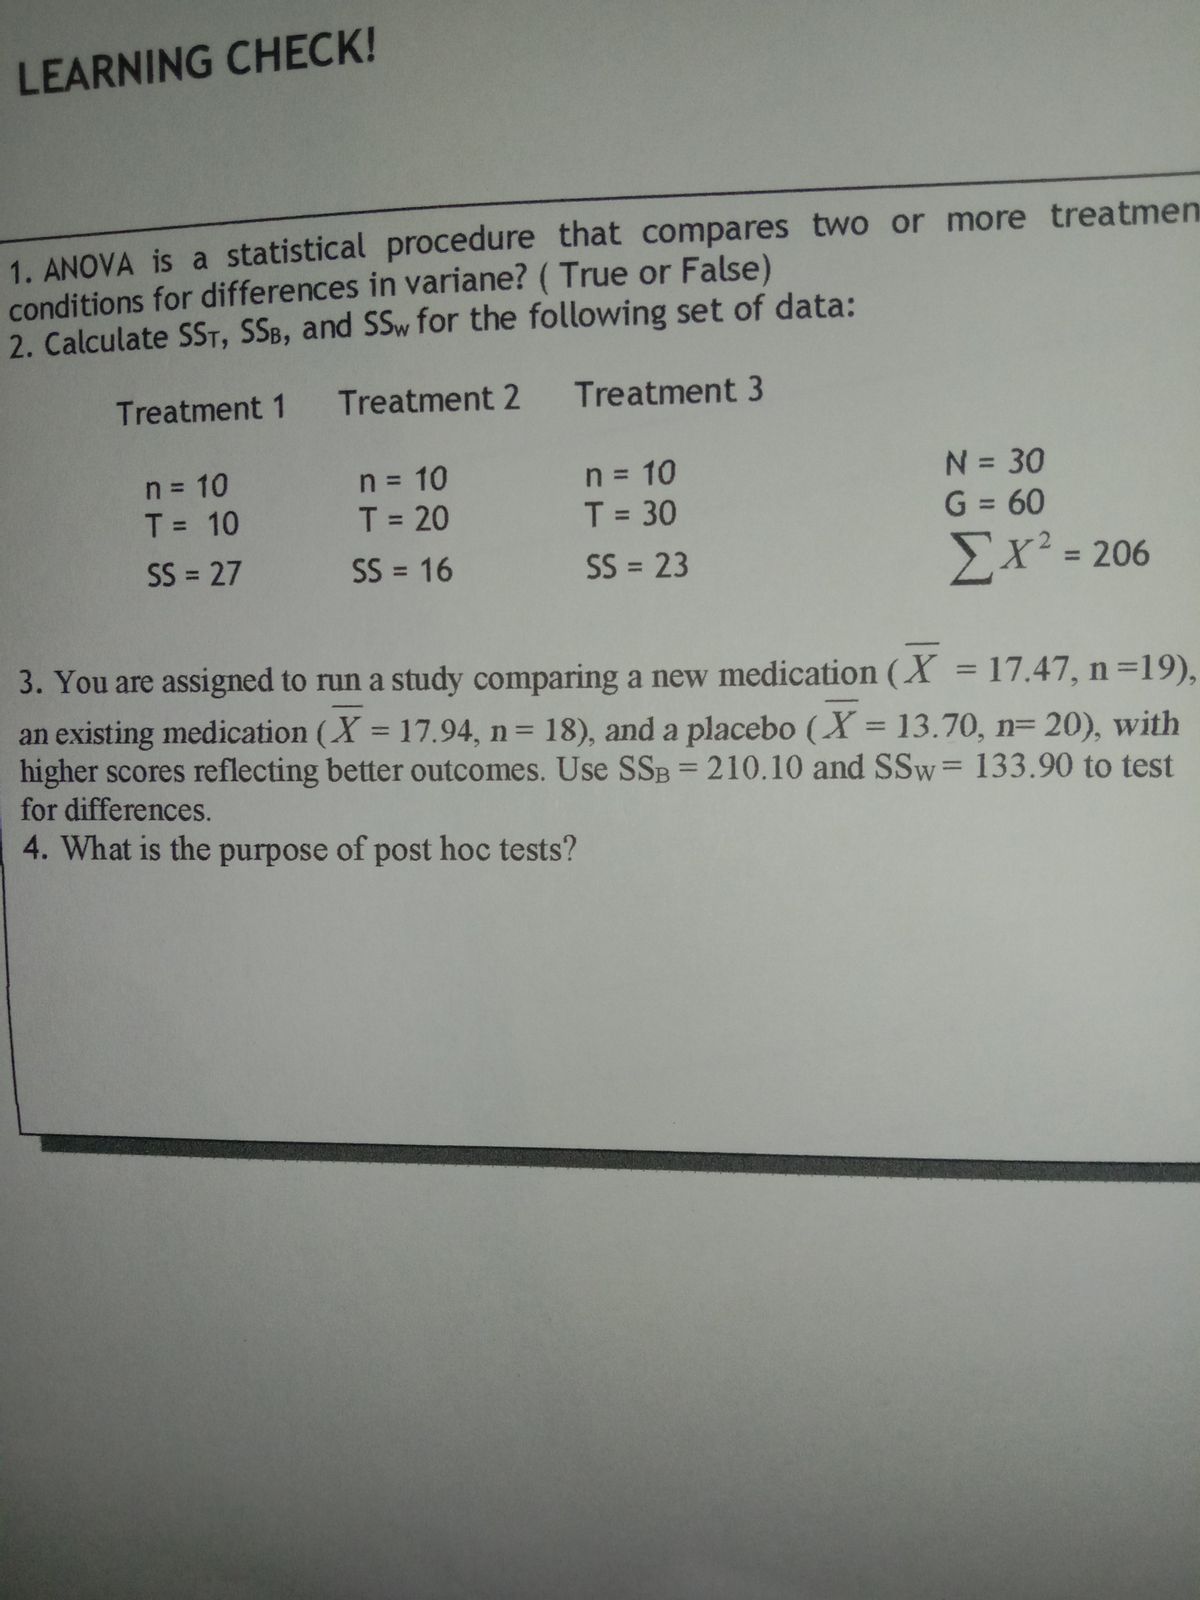

Transcribed Image Text:LEARNING CHECK!
1. ANOVA is a statistical procedure that compares two or more treatmen
conditions for differences in variane? ( True or False)
2. Calculate SST, SSB, and SSw for the following set of data:
Treatment 1 Treatment 2 Treatment 3
n = 10
T= 10
= 10
T = 20
n = 10
T = 30
N = 30
G = 60
n
%3D
%3D
%3D
%3D
%3D
%3D
SS = 27
SS = 16
SS = 23
Σχ? - 206
%3D
%3D
3. You are assigned to run a study comparing a new medication (X = 17.47, n =19),
an existing medication (X = 17.94, n= 18), and a placebo (X = 13.70, n= 20), with
higher scores reflecting better outcomes. Use SSB = 210.10 and SSw= 133.90 to test
%3D
%3D
%3D
%3D
%3D
for differences.
4. What is the purpose of post hoc tests?
Expert Solution
This question has been solved!
Explore an expertly crafted, step-by-step solution for a thorough understanding of key concepts.

Step by stepSolved in 4 steps

Knowledge Booster


Learn more about
Need a deep-dive on the concept behind this application? Look no further. Learn more about this topic, statistics and related others by exploring similar questions and additional content below.Similar questions
- Can you help asap, pleasearrow_forwardneed answer and all the workarrow_forwardCan you please help me with this problem and the three parts that come along with it because i don't understand the problem and i just don't get it. Can you do this problem step by step and can you label the three parts as well.arrow_forward
- Give me an example of a single factor design and an example of a factorial design. Provide the independent variable (IV) with its levels and dependent variable (DV) for the single factor design and the independent variables with their levels and DV for the factorial designarrow_forwardExplain why it can be dangerous to use the least-squares line to obtain predictions for x values that are substantially larger or smaller than those contained in the sample. The least-squares line is based on the x values ---Select--- ✓the sample. We do not know that the same linear relationship will apply for x values ---Select--- the range of values in the sample. Therefore the least-squares line should not be used for x values ---Select--- the range of values in the sample.arrow_forwardHow large does a contingency table need to be for statistical analysis? at least 2 rows, 2 columns (2x2) Oat least 2x3 at least 4x2 at least 10x10arrow_forward
arrow_back_ios
arrow_forward_ios
Recommended textbooks for you
- MATLAB: An Introduction with ApplicationsStatisticsISBN:9781119256830Author:Amos GilatPublisher:John Wiley & Sons Inc
 Probability and Statistics for Engineering and th...StatisticsISBN:9781305251809Author:Jay L. DevorePublisher:Cengage Learning
 Statistics for The Behavioral Sciences (MindTap C...StatisticsISBN:9781305504912Author:Frederick J Gravetter, Larry B. WallnauPublisher:Cengage Learning
  Elementary Statistics: Picturing the World (7th E...StatisticsISBN:9780134683416Author:Ron Larson, Betsy FarberPublisher:PEARSON
 The Basic Practice of StatisticsStatisticsISBN:9781319042578Author:David S. Moore, William I. Notz, Michael A. FlignerPublisher:W. H. Freeman
 Introduction to the Practice of StatisticsStatisticsISBN:9781319013387Author:David S. Moore, George P. McCabe, Bruce A. CraigPublisher:W. H. Freeman
MATLAB: An Introduction with Applications
Statistics
ISBN:9781119256830
Author:Amos Gilat
Publisher:John Wiley & Sons Inc
Probability and Statistics for Engineering and th...
Statistics
ISBN:9781305251809
Author:Jay L. Devore
Publisher:Cengage Learning
Statistics for The Behavioral Sciences (MindTap C...
Statistics
ISBN:9781305504912
Author:Frederick J Gravetter, Larry B. Wallnau
Publisher:Cengage Learning
Elementary Statistics: Picturing the World (7th E...
Statistics
ISBN:9780134683416
Author:Ron Larson, Betsy Farber
Publisher:PEARSON
The Basic Practice of Statistics
Statistics
ISBN:9781319042578
Author:David S. Moore, William I. Notz, Michael A. Fligner
Publisher:W. H. Freeman
Introduction to the Practice of Statistics
Statistics
ISBN:9781319013387
Author:David S. Moore, George P. McCabe, Bruce A. Craig
Publisher:W. H. Freeman