
ENGR.ECONOMIC ANALYSIS
14th Edition
ISBN: 9780190931919
Author: NEWNAN
Publisher: Oxford University Press
expand_more
expand_more
format_list_bulleted
Related questions
Question
thumb_up100%
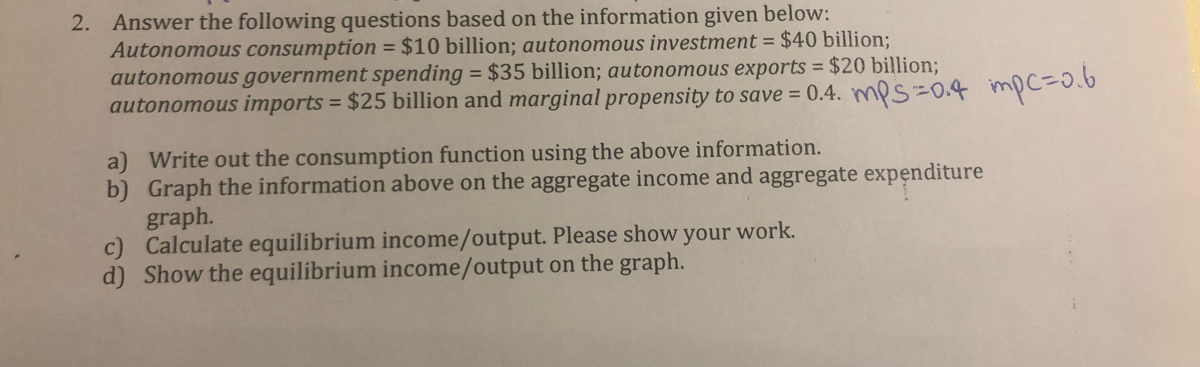

Transcribed Image Text:2. Answer the following questions based on the information given below:
Autonomous consumption = $10 billion; autonomous investment = $40 billion;
autonomous government spending = $35 billion; autonomous exports = $20 billion;
autonomous imports = $25 billion and marginal propensity to save = 0.4. mps = 0.4 mpc=0.6
a) Write out the consumption function using the above information.
b) Graph the information above on the aggregate income and aggregate expenditure
graph.
Calculate equilibrium income/output. Please show your work.
d) Show the equilibrium income/output on the graph.
Expert Solution
This question has been solved!
Explore an expertly crafted, step-by-step solution for a thorough understanding of key concepts.

This is a popular solution

Trending nowThis is a popular solution!

Step by stepSolved in 2 steps with 1 images

Knowledge Booster


Learn more about
Need a deep-dive on the concept behind this application? Look no further. Learn more about this topic, economics and related others by exploring similar questions and additional content below.Similar questions
- Please answer everything in the photo including the graph.arrow_forwardThe Image attached titled Table 1 is data for a hypothetical private-closed economy. Use the information in the Table 1 to analyze aggregate expenditures (AE) model attached (Figure 1. Equilibrium in a Private Closed Economy). Question 1 Identify the mistake and explain why the graph of the aggregate expenditures line does not correctly illustrate the economy's equilibrium. Question 2 Chart the aggregate expenditures (AE) model in Excel using the data from Table 1: A Private Closed Economy. Remember, the 45degree line (also known as the Keynesian Cross) is a tool that shows how differences in aggregate expenditures and real GDP can affect business inventories which will affect future levels of real GDP. Aggregate expenditure and GDP are both function of consumption, investment, government spending, and net exports. So, the equations for the two are identical: Y = C + I + G + NX, and AE (aggregate expenditure) = C + I + G + NX For private closed economy the equation…arrow_forward5. Graphing the saving and consumption functions from MPC Consider a hypothetical economy in which the marginal propensity to consume (MPC) is 0.5. That is, if disposable income increases by $1, consumption increases by 50¢. Suppose further that last year, disposable income in the economy was $300 billion and consumption was $250 billion. Based on these data, use the blue line (circle symbols) to plot this economy's consumption function on the following graph. REAL CONSUMER SPENDING (Billions of dollars) 700 600 500 400 300 200 100 0 Aa Aa -100 Consumption Fn. O O 0 100 200 300 400 500 600 700 800 REAL DISPOSABLE INCOME (Billions of dollars) Help Clear All Suppose that this year, disposable income is projected to be $340 billion. Based on your analysis, you would expect consumption to be and saving to bearrow_forward
- How would I do g?arrow_forwardQ1:You are given the following income-expenditures model for an economy : Consumption C = 300 + .64Yd Tax (T) = $60 Government expenditure G = $100 Investment (I) = $120 From above data calculate the follows: 1. Equilibrium level of income 2. At the equilibrium level of income, what is the amount of consumption?arrow_forwardAggregate Expenditures and Multipliers Assignment a. Using the aggregate expenditure function above, what is the current level of real GDP? b. Using the aggregate expenditure function above, what would be the level of real GDP if the aggregate expenditure function shifted up by $0.2T? c. If Investment expenditures increase by $300B and MPC is equal to 0.90, what will be the increase in real GDP? d. If Government expenditures increase by $800B and MPS is equal to 0.05, what will be the increase in real GDP?arrow_forward
- The graph represents consumption (C) as a function of disposable income (DI). Assume the consumption function is linear. What is the value of the marginal propensity to consume (MPC)? Round the value of the MPC to two decimal places. MPC = Consumption $1050 900 750 600 450 300 150 0 $150 300 450 600 C = DI C 750 900 1050 Disposable incomearrow_forwardQuestions attached belowarrow_forwardThis question has four parts, here is the fourth and final part. 1.4. Create a graph for the aggregate expenditures (AE) model in Excel using the data from Table 1: A Private Closed Economy. (table 1 is in the attachment) tips: Remember, the 45degree line (also known as the Keynesian Cross) is a tool that shows how differences in aggregate expenditures and real GDP can affect business inventories which will affect future levels of real GDP. Aggregate expenditure and GDP are both function of consumption, investment, government spending, and net exports. So, the equations for the two are identical: Y = C + I + G + NX, and AE (aggregate expenditure) = C + I + G + NX For private closed economy the equation is: Y = C + I , and AE (aggregate expenditure) = C + Iarrow_forward
- Assume a closed economy in which disposable income starts at 1,000 and increases by 500; consumption starts at 1,100 and increases by 300; investment spending is 1,000 and government spending is 500. 1. The marginal propensity to consume (MPC) is equal to: 0.5 0.6 0.7 6 2. The multiplier is: 0.25 2 2.5 3 3.The consumption equation is: C = 500 + 0.6DI C = 500 + 0.5DI C = 100 + 0.75DI C = 100 + 0.6DI 4. Let ∆I = 1,000. What is the new equilibrium GDP" 7,000 7,500 2,000 8,500arrow_forwardStiller 1. Suppose an economy is represented by the following equations. Consumption function C = 100 + 0.8Yd Planned investment I = 38 Government spending G = 75 Exports EX = 25 Imports IM= 0.05Yd Autonomous Taxes T = 40 Planned aggregate expenditure AE = C + I + G + (EX - IM) a. By using the above information calculate the equilibrium level of income for this economy, b. Calculate the value of expenditure multiplier. c. Suppose that government spending is increased by 5, what will happen to the equilibrium income level?arrow_forwardThe economy is in equilibrium such that Planned Aggregate Expenditure (AE) = Aggregate Output (Y) = 1,200. We have earlier observed that when Y increased from 900 to 1,200 Aggregate Consumption (C) increased from 800 to 1000. If investments increase by 55, how much will Aggregate Income change from its current value of 1,200? 110 82.5 165 1,365 1,310arrow_forward
arrow_back_ios
SEE MORE QUESTIONS
arrow_forward_ios
Recommended textbooks for you
 Principles of Economics (12th Edition)EconomicsISBN:9780134078779Author:Karl E. Case, Ray C. Fair, Sharon E. OsterPublisher:PEARSON
 Engineering Economy (17th Edition)EconomicsISBN:9780134870069Author:William G. Sullivan, Elin M. Wicks, C. Patrick KoellingPublisher:PEARSON
 Principles of Economics (MindTap Course List)EconomicsISBN:9781305585126Author:N. Gregory MankiwPublisher:Cengage Learning
 Managerial Economics: A Problem Solving ApproachEconomicsISBN:9781337106665Author:Luke M. Froeb, Brian T. McCann, Michael R. Ward, Mike ShorPublisher:Cengage Learning
 Managerial Economics & Business Strategy (Mcgraw-...EconomicsISBN:9781259290619Author:Michael Baye, Jeff PrincePublisher:McGraw-Hill Education
Principles of Economics (12th Edition)
Economics
ISBN:9780134078779
Author:Karl E. Case, Ray C. Fair, Sharon E. Oster
Publisher:PEARSON
Engineering Economy (17th Edition)
Economics
ISBN:9780134870069
Author:William G. Sullivan, Elin M. Wicks, C. Patrick Koelling
Publisher:PEARSON
Principles of Economics (MindTap Course List)
Economics
ISBN:9781305585126
Author:N. Gregory Mankiw
Publisher:Cengage Learning
Managerial Economics: A Problem Solving Approach
Economics
ISBN:9781337106665
Author:Luke M. Froeb, Brian T. McCann, Michael R. Ward, Mike Shor
Publisher:Cengage Learning
Managerial Economics & Business Strategy (Mcgraw-...
Economics
ISBN:9781259290619
Author:Michael Baye, Jeff Prince
Publisher:McGraw-Hill Education