MATLAB: An Introduction with Applications
6th Edition
ISBN: 9781119256830
Author: Amos Gilat
Publisher: John Wiley & Sons Inc
expand_more
expand_more
format_list_bulleted
Question

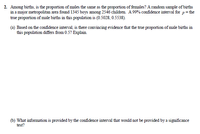
Transcribed Image Text:2. Among births, is the proportion of males the same as the proportion of females? A random sample of births
in a major metropolitan area found 1345 boys among 2546 children. A 99% confidence interval for p= the
true proportion of male births in this population is (0.5028, 0.5538).
(a) Based on the confidence interval, is there convincing evidence that the true proportion of male births in
this population differs from 0.5? Explain.
(b) What information is provided by the confidence interval that would not be provided by a significance
test?
Expert Solution
This question has been solved!
Explore an expertly crafted, step-by-step solution for a thorough understanding of key concepts.
This is a popular solution
Trending nowThis is a popular solution!
Step by stepSolved in 2 steps with 2 images

Knowledge Booster
Similar questions
- Alfredo wants a 85% confidence interval for the true average gas mileage for a Gremlin after randomly sampling 9 Gremlins. It is known that the true sigma for Gremlin gas mileage is 4 mpg, and the average of the 9 Gremlins in Alfredo's study was 24 mpg. Find the confidence interval assuming the distribution is normal.arrow_forwardA random sample of 100 employees at a company shows that 62 are female. Form a 90% confidence interval for the proportion of all employees who are female. The interval is 0.62 what margin of error? Round your answer to 3 decimal places.arrow_forwardIt is estimated that in the general population about 9 out of every 1000 or 0.009 children are diagnosed with autism. on study included 92 six month old babies who had a sibling with autism. twenty-eight of these babies were later diagnosed with autism. we will systematically construct a 99% confidence interval for the proportion of siblings of autistic children likely to have autism. What is the population being studied? What population parameter are we seeking to estimate? Describe this population parameter in words.arrow_forward
- We wish to estimate what percent of adult residents in a certain county are parents. Out of 600 adult residents sampled, 228 had kids. Based on this, construct a 90% confidence interval for the proportion � of adult residents who are parents in this county. < � <arrow_forwardThe mean score on the math portion of the ACT for the year 2000 is μ = 20.7. A sample of 20 students in a local school district had a mean of 22.95. Using the sample, a 95% confidence interval estimate for the mean is (20.76, 25.14). State the point estimate for the mean ACT score for students. Based on this sample information , do you believe that the local students have a mean different from the general population? Why? 22.95 is in the center of the interval. The means are definitely not different. 22.95 is just outside the 95% confidence interval. Can't say the means are really different. 22.95 is not equal to 20.7. The means are definitely different. 20.7 is just outside the 95% confidence interval. Can't say the means are really different.arrow_forwardWe wish to estimate what percent of adult residents in a certain county are parents. Out of 200 adult residents sampled, 34 had kids. Based on this, construct a 90% confidence interval for the proportion, p, of adult residents who are parents in this county. Give your answers as decimals, to three places.arrow_forward
- I want to estimate the population mean number of times that adults eat breakfast in a week. I spoke with 12 coworkers, and the numbers were 7, 5, 5, 7, 2, 3, 7, 5, 1, 0, 7, 6. Calculate a 95% confidence interval for the population mean (round 3 decimal places).arrow_forwardWe randomly sample 600 people in a specific town. 342 of them like cats. Based on this, construct a 95% confidence interval for the true population proportion of people in this town who like cats. Give your answers as decimals, rounded to four places.arrow_forwardIf n=550 and p' (p-prime) = 0.19, construct a 90% confidence interval.Give your answers to three decimals.arrow_forward
arrow_back_ios
arrow_forward_ios
Recommended textbooks for you
 MATLAB: An Introduction with ApplicationsStatisticsISBN:9781119256830Author:Amos GilatPublisher:John Wiley & Sons Inc
 Probability and Statistics for Engineering and th...StatisticsISBN:9781305251809Author:Jay L. DevorePublisher:Cengage Learning
 Statistics for The Behavioral Sciences (MindTap C...StatisticsISBN:9781305504912Author:Frederick J Gravetter, Larry B. WallnauPublisher:Cengage Learning
 Elementary Statistics: Picturing the World (7th E...StatisticsISBN:9780134683416Author:Ron Larson, Betsy FarberPublisher:PEARSON
 The Basic Practice of StatisticsStatisticsISBN:9781319042578Author:David S. Moore, William I. Notz, Michael A. FlignerPublisher:W. H. Freeman
 Introduction to the Practice of StatisticsStatisticsISBN:9781319013387Author:David S. Moore, George P. McCabe, Bruce A. CraigPublisher:W. H. Freeman

MATLAB: An Introduction with Applications
Statistics
ISBN:9781119256830
Author:Amos Gilat
Publisher:John Wiley & Sons Inc

Probability and Statistics for Engineering and th...
Statistics
ISBN:9781305251809
Author:Jay L. Devore
Publisher:Cengage Learning

Statistics for The Behavioral Sciences (MindTap C...
Statistics
ISBN:9781305504912
Author:Frederick J Gravetter, Larry B. Wallnau
Publisher:Cengage Learning

Elementary Statistics: Picturing the World (7th E...
Statistics
ISBN:9780134683416
Author:Ron Larson, Betsy Farber
Publisher:PEARSON

The Basic Practice of Statistics
Statistics
ISBN:9781319042578
Author:David S. Moore, William I. Notz, Michael A. Fligner
Publisher:W. H. Freeman

Introduction to the Practice of Statistics
Statistics
ISBN:9781319013387
Author:David S. Moore, George P. McCabe, Bruce A. Craig
Publisher:W. H. Freeman