MATLAB: An Introduction with Applications
6th Edition
ISBN: 9781119256830
Author: Amos Gilat
Publisher: John Wiley & Sons Inc
expand_more
expand_more
format_list_bulleted
Question
Develop a 99% confidence interval of the difference between the

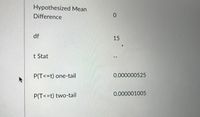
Transcribed Image Text:Hypothesized Mean
Difference
df
t Stat
P(T<=t) one-tail
P(T<=t) two-tail
0
15
--
0.000000525
0.000001005

Transcribed Image Text:X
+
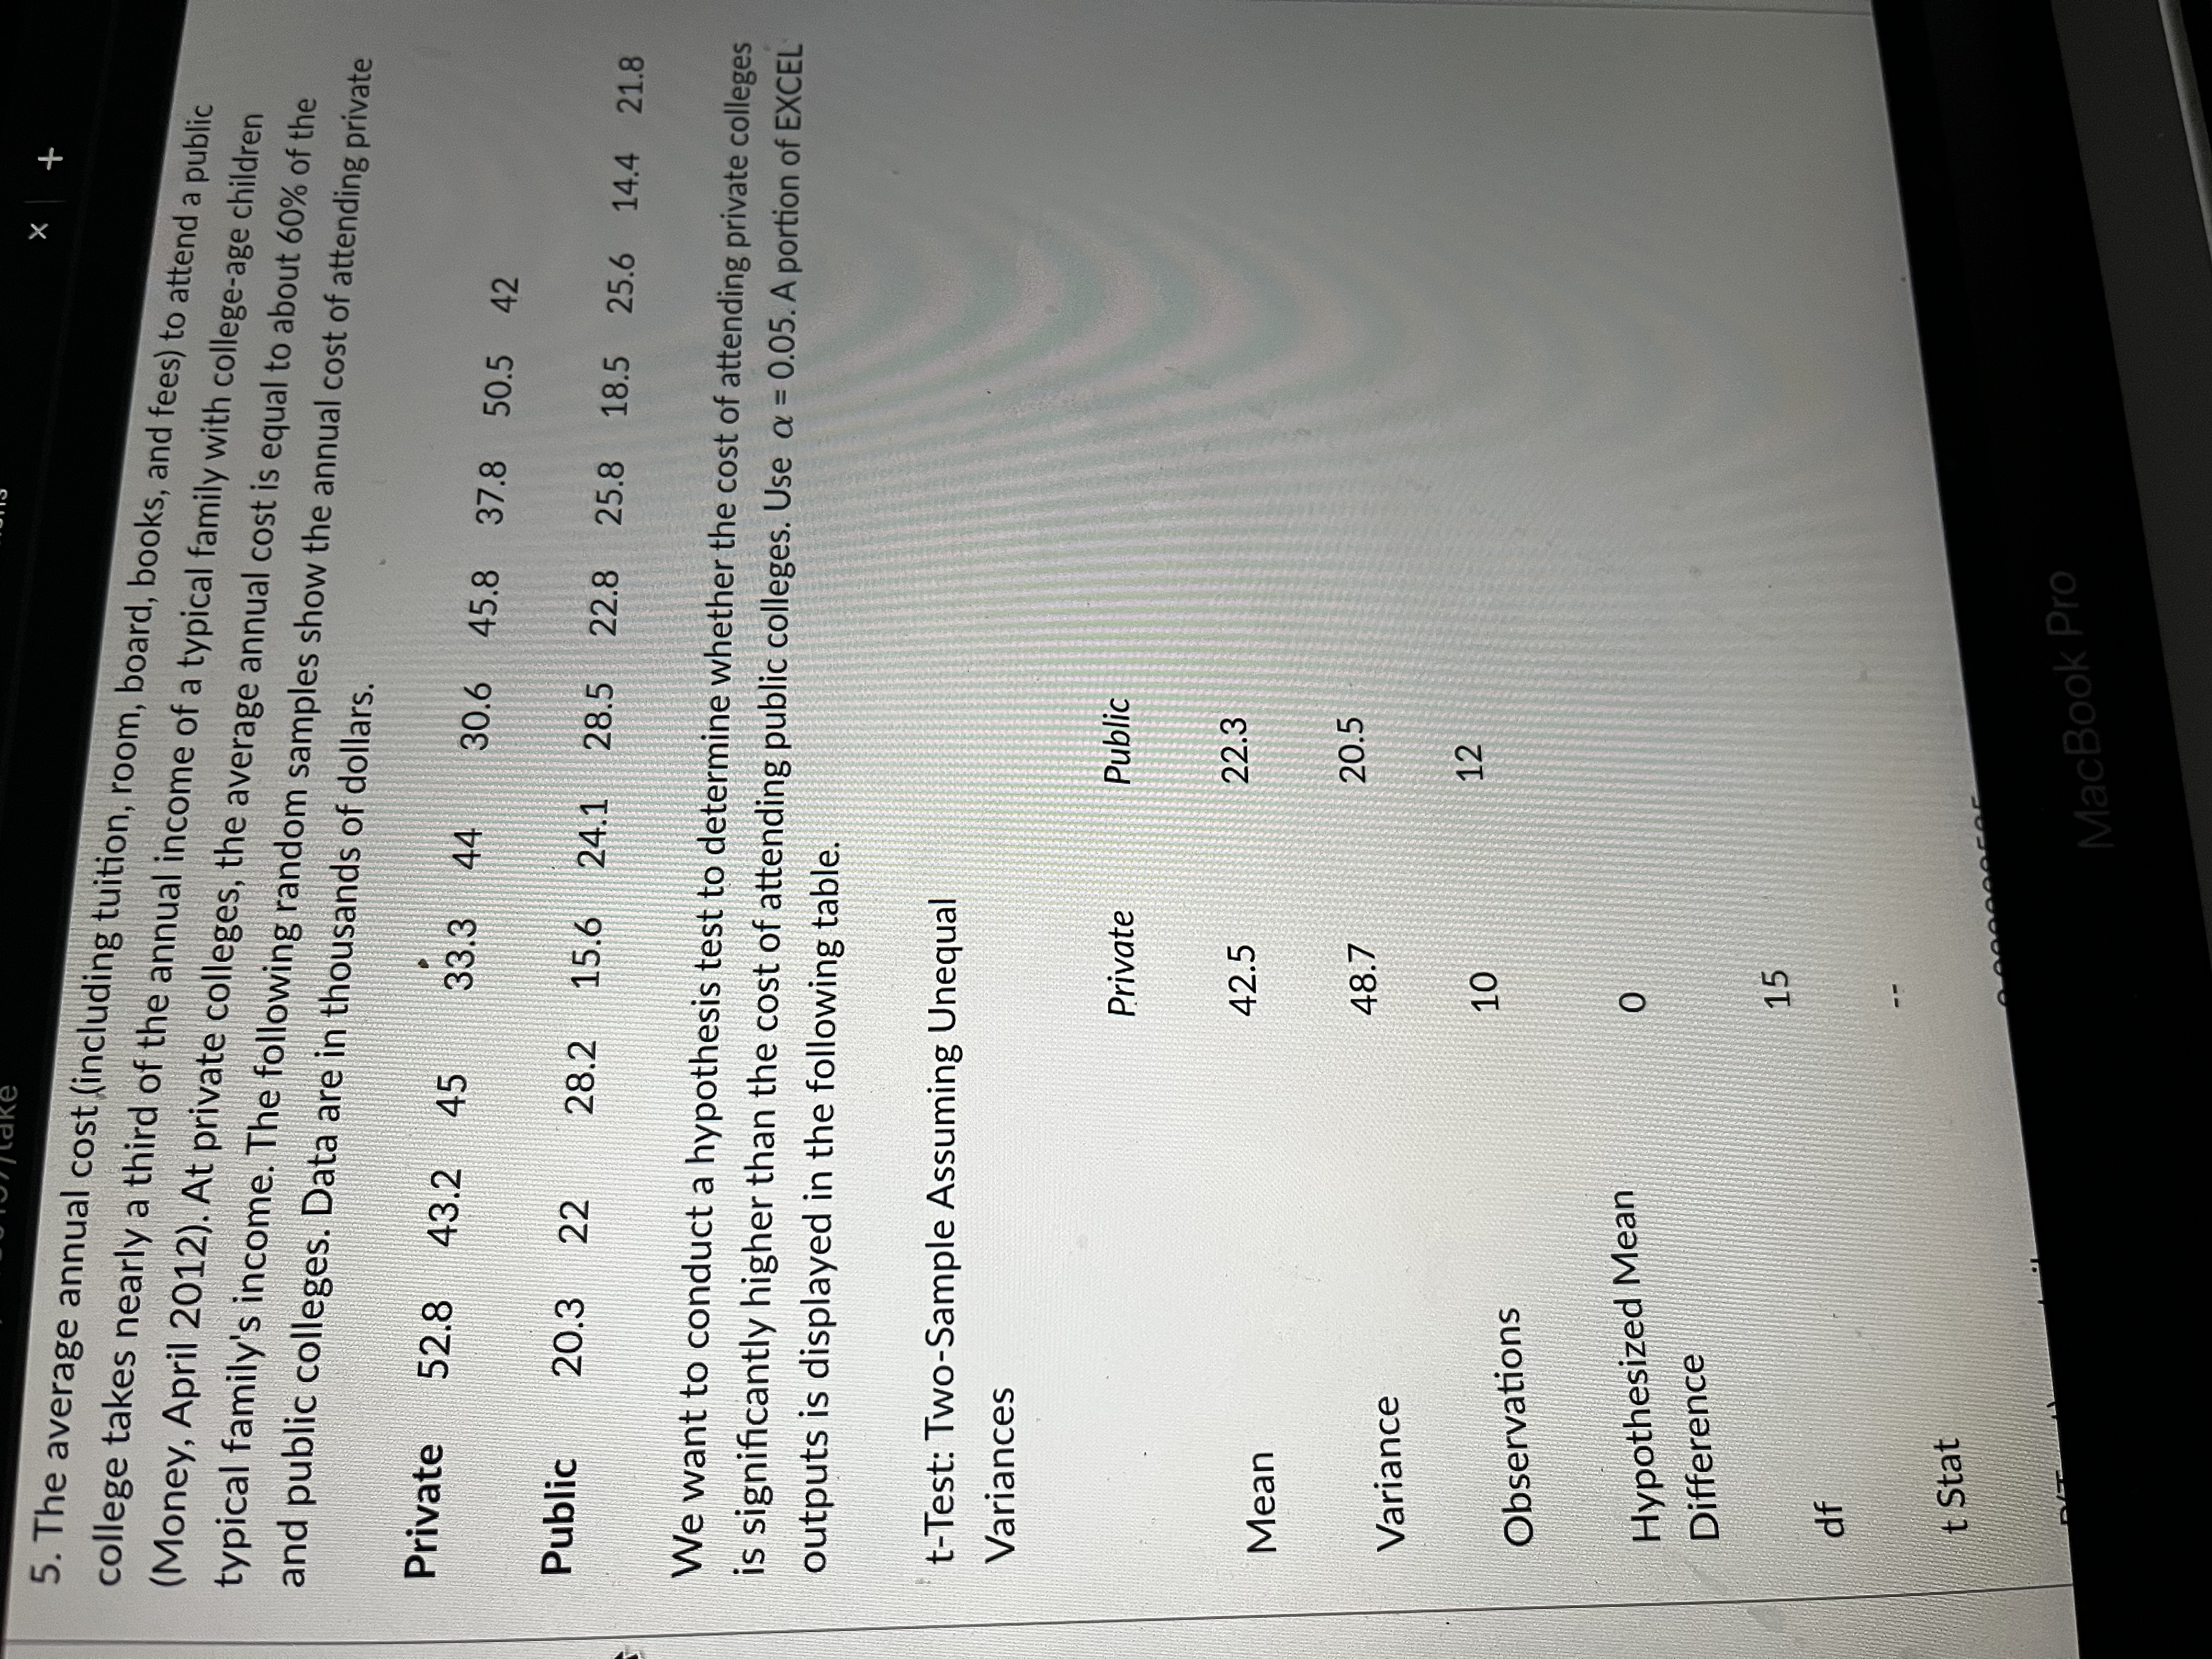
5. The average annual cost (including tuition, room, board, books, and fees) to attend a public
college takes nearly a third of the annual income of a typical family with college-age children
(Money, April 2012). At private colleges, the average annual cost is equal to about 60% of the
and public colleges. Data are in thousands of dollars.
typical family's income. The following random samples show the annual cost of attending private
Private 52.8 43.2 45
33.3 44
30.6 45.8 37.8 50.5 42
Public 20.3 22
28.2 15.6 24.1 28.5 22.8 25.8 18.5 25.6 14.4 21.8
We want to conduct a hypothesis test to determine whether the cost of attending private colleges
is significantly higher than the cost of attending public colleges. Use a = 0.05. A portion of EXCEL
outputs is displayed in the following table.
t-Test: Two-Sample Assuming Unequal
Variances
Private
Public
42.5
22.3
Mean
48.7
20.5
Variance
12
10
Observations
Hypothesized Mean
Difference
df
t Stat
0
15
COC
MacBook Pro
Expert Solution
This question has been solved!
Explore an expertly crafted, step-by-step solution for a thorough understanding of key concepts.
This is a popular solution
Trending nowThis is a popular solution!
Step by stepSolved in 2 steps with 2 images

Knowledge Booster
Similar questions
- un a test of the effectiveness of garlic for lowering cholesterol, 49 subjects were treated with garlic in a processed tablet form. Cholesterol levels were measured before and after the treatment. The changes (before - after) in their levels of LDL cholesterol (in mg/dL) have a mean of 2.8 and a standard deviation of 19.5. Construct a 99% confidence interval estimate of the mean net change in LDL cholesterol after the garlic treatment. What does the confidence interval suggest about the effectiveness of garlic in reducing LDL cholesterol? Click here to view a t distribution table. Click here to view page 1 of the standard normal distribution table. Click here to view page 2 of the standard normal distribution table. .... What is the confidence interval estimate of the population mean µ? mg/dL < µarrow_forwarda survey found 91% of 5101 us adults are concerned about how their children perform if school. using 96% confidence level find margin of error and assume normal distributionarrow_forwardIf a research study in biomedical field found a moderate negative and statistically significant relationship between two variables, which of the following statistical parameters would you expect to see? -.48, p<.05 -48, p<.01 -.68, p<.01 1, p<.01arrow_forwardWhat is different about the normality requirement for a confidence interval estimate of the population standard deviation and the normality requirement for a confidence interval estimate of the population mean?arrow_forwardUse the data on student load Student Unit Load 3, 12, 6, 9, 6, 12, 15, 12, 7, 9, 3 What is the point estimate for mean student unit load? Construct the 90% confidence interval for mean student load. Assume all requirements have been met.arrow_forwardIs there a significant relationship between subject’s IQ and pre-test scores? Treatment Gender Pre_score Post_score IQ hours_studied 1.00 1.00 9.40 10.80 111.00 5.00 1.00 1.00 8.60 9.20 114.00 6.00 1.00 1.00 11.10 13.30 111.00 5.00 2.00 1.00 11.60 14.20 106.00 5.00 2.00 1.00 9.80 11.30 107.00 6.00 2.00 1.00 4.70 12.00 112.00 7.00 3.00 1.00 8.20 12.50 115.00 5.00 3.00 1.00 12.40 11.70 115.00 6.00 3.00 1.00 7.30 10.40 107.00 7.00 1.00 2.00 6.40 11.70 98.00 2.00 1.00 2.00 12.90 15.80 128.00 9.00 1.00 2.00 9.40 10.80 95.00 5.00 2.00 2.00 8.20 10.40 103.00 6.00 2.00 2.00 5.60 7.50 78.00 4.00 2.00 2.00 6.00 4.50 90.00 4.00 3.00 2.00 8.20 8.00 86.00 3.00 3.00 2.00 10.30 10.80 115.00 6.00 3.00 2.00 8.20 8.00 90.00 5.00 Select the appropriate statistical test, state the null and alternative hypotheses, determine the correct criterion for testing the hypothesis, and obtain the correct statistics.arrow_forwardWhat impact does fast-food consumption have on various dietary and health characteristics? A research article reported the accompanying summary statistics on daily calorie intake for a representative sample of teens who do not typically eat fast food and a representative sample of teens who do eat fast food. Construct a 95% confidence interval estimate of the difference in mean daily calorie intake for teens who do eat fast food on a typical day and those who do not.arrow_forwardwhat is the minimum pregnancy length that can be in the top 8% of pregnancy given a mean of 265 and a standard deviation of 12arrow_forwardhow do you develop 95% confidence intervals for the mean age and house income of subcsribers in excel? This could be any number, I just don't know how to input something like this on excelarrow_forwardarrow_back_iosarrow_forward_ios
Recommended textbooks for you
 MATLAB: An Introduction with ApplicationsStatisticsISBN:9781119256830Author:Amos GilatPublisher:John Wiley & Sons Inc
 Probability and Statistics for Engineering and th...StatisticsISBN:9781305251809Author:Jay L. DevorePublisher:Cengage Learning
 Statistics for The Behavioral Sciences (MindTap C...StatisticsISBN:9781305504912Author:Frederick J Gravetter, Larry B. WallnauPublisher:Cengage Learning
 Elementary Statistics: Picturing the World (7th E...StatisticsISBN:9780134683416Author:Ron Larson, Betsy FarberPublisher:PEARSON
 The Basic Practice of StatisticsStatisticsISBN:9781319042578Author:David S. Moore, William I. Notz, Michael A. FlignerPublisher:W. H. Freeman
 Introduction to the Practice of StatisticsStatisticsISBN:9781319013387Author:David S. Moore, George P. McCabe, Bruce A. CraigPublisher:W. H. Freeman

MATLAB: An Introduction with Applications
Statistics
ISBN:9781119256830
Author:Amos Gilat
Publisher:John Wiley & Sons Inc

Probability and Statistics for Engineering and th...
Statistics
ISBN:9781305251809
Author:Jay L. Devore
Publisher:Cengage Learning

Statistics for The Behavioral Sciences (MindTap C...
Statistics
ISBN:9781305504912
Author:Frederick J Gravetter, Larry B. Wallnau
Publisher:Cengage Learning

Elementary Statistics: Picturing the World (7th E...
Statistics
ISBN:9780134683416
Author:Ron Larson, Betsy Farber
Publisher:PEARSON

The Basic Practice of Statistics
Statistics
ISBN:9781319042578
Author:David S. Moore, William I. Notz, Michael A. Fligner
Publisher:W. H. Freeman

Introduction to the Practice of Statistics
Statistics
ISBN:9781319013387
Author:David S. Moore, George P. McCabe, Bruce A. Craig
Publisher:W. H. Freeman