MATLAB: An Introduction with Applications
6th Edition
ISBN: 9781119256830
Author: Amos Gilat
Publisher: John Wiley & Sons Inc
expand_more
expand_more
format_list_bulleted
Question

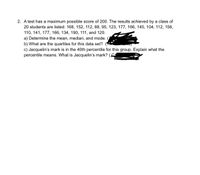
Transcribed Image Text:2. A test has a maximum possible score of 200. The results achieved by a class of
20 students are listed: 168, 152, 112, 88, 95, 123, 177, 166, 145, 104, 112, 156,
110, 141, 177, 166, 134, 190, 111, and 120.
a) Determine the mean, median, and mode.
b) What are the quartiles for this data set?
c) Jacquelin's mark is in the 40th percentile for this group. Explain what the
percentile means. What is Jacquelin's mark? (4
Expert Solution
This question has been solved!
Explore an expertly crafted, step-by-step solution for a thorough understanding of key concepts.
Step by stepSolved in 2 steps with 2 images

Knowledge Booster
Similar questions
- Ten novels were randomly selected, and the number of pages were recorded as follows: 415 398 402 399 400 405 395 401 412 407 Calculate the mean of the data set. Ten novels were randomly selected, and the number of pages were recorded as follows: 415 398 402 399 400 405 395 401 412 407 Calculate the mean of the data set. 395 401.5 403.4 407 399arrow_forwardIdentify whether the following data set is a population or a sample. A news reporter is conducting a study of Phoenix High School teachers. The reporter determined the average annual salary of all of the teachers at Phoenix High School. a) Sample b) Populationarrow_forward2. Which gender is taller, males or females? A sample of 14-year-olds from the United Kingdom was randomly selected using the CensusAtSchool website. Create an appropriate stemplot. Here are the heights of the students (in cm): Male: 154, 157, 187, 163, 167, 159, 169, 162, 176, 177, 151, 175, 174, 165, 165, 183, 180 Female: 160, 169, 152, 167, 164, 163, 160, 163, 169, 157, 158, 153, 161, 165, 165, 159, 168, 153, 166, 158, 158, 166arrow_forward
- 1:Find the mean, median and mode for each set of data. a) 64, 69, 72, 54, 89, 92 b) 6, 0, 8, 2, 9, 5,6,7,7,8arrow_forwardFind the percentile of the sample data 20 and 37.arrow_forwardThe following are the weights (in pounds) of 14 cows: 96, 99, 128, 151, 157, 179, 219, 249, 255, 301, 324, 345, 387, 390 (a) Find the median of the data. Don’t forget to justify your answer. (b) Draw a reasonable stem-and-leaf display of the data.arrow_forward
- Data was collected for 322 randomly selected 10 minute intervals. For each ten-minute interval, the number of people entering the atrium of a large mall were recorded. The data is summarized in the table below. Number of Guests Frequency 220 – 224 98 225 – 229 81 230 – 234 36 235 – 239 63 240 – 244 44 What is the class width for this GFDT?Class width =arrow_forwardA congressperson wants to come up with a single value to describe the prices of homes in their district. However, their district consists of a few homes that are extremely expensive compared to the others. Which descriptive statistic should they use? a. Range b. Mode c. Median d. Meanarrow_forwardThe following set of data is given 78,79,79,79, 80, 82, 82, 85, 86, 88, 89, 92, 97. For this set of data find: a) The value of the median and the quartiles. b) The mean, mode and the standard deviation. c) Draw a suitably labelled box plot and determine the interquartile range. d) State if there is any type of skewarrow_forward
- The following are the distances (in miles) to the nearest airport for 11 families. 6, 7, 9, 19, 20, 21, 22, 31, 31, 35, 37 Notice that the numbers are ordered from least to greatest. Give the five-number summary and the interquartile range for the data set. Five-number summary Minimum: Lower quartile: Median: Upper quartile: Maximum: Interquartile range: ☐arrow_forwardData was collected for 310 randomly selected 10 minute intervals. For each ten-minute interval, the number of people entering the atrium of a large mall were recorded. The data is summarized in the table below. Number of Guests 200-209 210-219 220-229 230-239 240-249 Frequency Class width= 95 58 19 95 43 What is the class width for this GFDT?arrow_forward3. The following ages of 11 music teachers in a school district. Notice that the ages are ordered from least to greatest Give the five-number summary and the interquartile range (IQR) for the data set: 33,34,37,39,40,40,45,48,50,56,57 Minimum: Maximum: Median: Q1: Q3: IQR:arrow_forward
arrow_back_ios
SEE MORE QUESTIONS
arrow_forward_ios
Recommended textbooks for you
 MATLAB: An Introduction with ApplicationsStatisticsISBN:9781119256830Author:Amos GilatPublisher:John Wiley & Sons Inc
 Probability and Statistics for Engineering and th...StatisticsISBN:9781305251809Author:Jay L. DevorePublisher:Cengage Learning
 Statistics for The Behavioral Sciences (MindTap C...StatisticsISBN:9781305504912Author:Frederick J Gravetter, Larry B. WallnauPublisher:Cengage Learning
 Elementary Statistics: Picturing the World (7th E...StatisticsISBN:9780134683416Author:Ron Larson, Betsy FarberPublisher:PEARSON
 The Basic Practice of StatisticsStatisticsISBN:9781319042578Author:David S. Moore, William I. Notz, Michael A. FlignerPublisher:W. H. Freeman
 Introduction to the Practice of StatisticsStatisticsISBN:9781319013387Author:David S. Moore, George P. McCabe, Bruce A. CraigPublisher:W. H. Freeman

MATLAB: An Introduction with Applications
Statistics
ISBN:9781119256830
Author:Amos Gilat
Publisher:John Wiley & Sons Inc

Probability and Statistics for Engineering and th...
Statistics
ISBN:9781305251809
Author:Jay L. Devore
Publisher:Cengage Learning

Statistics for The Behavioral Sciences (MindTap C...
Statistics
ISBN:9781305504912
Author:Frederick J Gravetter, Larry B. Wallnau
Publisher:Cengage Learning

Elementary Statistics: Picturing the World (7th E...
Statistics
ISBN:9780134683416
Author:Ron Larson, Betsy Farber
Publisher:PEARSON

The Basic Practice of Statistics
Statistics
ISBN:9781319042578
Author:David S. Moore, William I. Notz, Michael A. Fligner
Publisher:W. H. Freeman

Introduction to the Practice of Statistics
Statistics
ISBN:9781319013387
Author:David S. Moore, George P. McCabe, Bruce A. Craig
Publisher:W. H. Freeman