
MATLAB: An Introduction with Applications
6th Edition
ISBN: 9781119256830
Author: Amos Gilat
Publisher: John Wiley & Sons Inc
expand_more
expand_more
format_list_bulleted
Related questions
Question
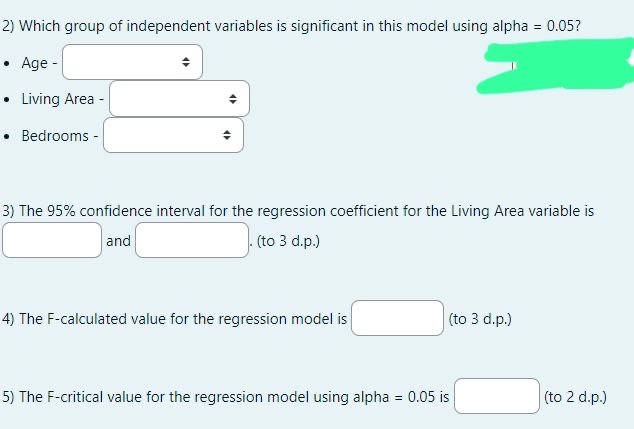

Transcribed Image Text:2) Which group of independent variables is significant in this model using alpha = 0.05?
Age -
• Living Area -
• Bedrooms -
.
3) The 95% confidence interval for the regression coefficient for the Living Area variable is
and
.(to 3 d.p.)
4) The F-calculated value for the regression model is
(to 3 d.p.)
5) The F-critical value for the regression model using alpha = 0.05 is
(to 2 d.p.)
![The partially completed regression output to predict the selling price of a house based on
the age of the house in years (Age), the living area of the house in square feet (Living Area)
and the number of bedrooms (Bedrooms) is given below
Regression Statistics
Multiple R
R Square
Adjusted R Square
Standard Error
Observations
ANOVA
Regression
Residual
Total
0.8486
36,009.01
df
SS
36,709,265,905.70
14 50,972,400,000.00
Coefficients Standard Error
108,597.3721
-580.6870
86.8282
31,261.9127
MS
101,922.3333
2,092.4981
27.6994
11,006.8696
t Stat
Intercept
Age
Living Area
Bedrooms
[NOTE: Do not include a comma in your response]
1)The predicted selling price for a home that is 10 years of age, has 2,000 square feet of
living area and has three bedrooms is $
(to 2 d.p.)](https://content.bartleby.com/qna-images/question/f1e278e2-7698-4777-ba79-35340af76281/a94841dd-47cf-4d90-9413-07bd386efcbb/7ukzzv5_processed.jpeg)
Transcribed Image Text:The partially completed regression output to predict the selling price of a house based on
the age of the house in years (Age), the living area of the house in square feet (Living Area)
and the number of bedrooms (Bedrooms) is given below
Regression Statistics
Multiple R
R Square
Adjusted R Square
Standard Error
Observations
ANOVA
Regression
Residual
Total
0.8486
36,009.01
df
SS
36,709,265,905.70
14 50,972,400,000.00
Coefficients Standard Error
108,597.3721
-580.6870
86.8282
31,261.9127
MS
101,922.3333
2,092.4981
27.6994
11,006.8696
t Stat
Intercept
Age
Living Area
Bedrooms
[NOTE: Do not include a comma in your response]
1)The predicted selling price for a home that is 10 years of age, has 2,000 square feet of
living area and has three bedrooms is $
(to 2 d.p.)
Expert Solution
This question has been solved!
Explore an expertly crafted, step-by-step solution for a thorough understanding of key concepts.

Step by stepSolved in 3 steps with 15 images

Knowledge Booster

Similar questions
- I couldn't include the options for the graphs because it only allows me to add two pictures.arrow_forwardA trucking company considered a multiple regression model for relating the dependent variable y = total daily travel time for one of its drivers (hours) to the predictors x₁ = distance traveled (miles) and x₂ = the number of deliveries made. Suppose that the model equation is Y = -0.800+ 0.060x₁ +0.900x₂ + e (a) What is the mean value of travel time when distance traveled is 50 miles and four deliveries are made? hr (b) How would you interpret ₁ = 0.060, the coefficient of the predictor x₁? O When the number of deliveries is constant, the average change in travel time associated with a ten-mile (i.e. one unit) increase in distance traveled is 0.060 hours. O The total daily travel time increases by 0.060 hours when the distance traveled increases by 1. O When the number of deliveries is held fixed, the average change in travel time associated with a one-mile (i.e. one unit) increase in distance traveled is 0.060 hours. O The average change in travel time associated with a one-mile (i.e.…arrow_forwardA regression was run to determine if there is a relationship between hours of study per week (X) and the test scores (y ). The results of the regression were:y=ax+ba=5.931b=20.1r2=0.748225r=0.865Use this to predict the final exam score of a student who studies 3 hours per week, and please round your answer to a whole number.arrow_forward
- When should a regression model not be used to make a prediction?arrow_forwardplease use this situation: A small theater company has a linear regression model to estimate y = the concession stand sales in dollars, based on knowing x = the number of people in attendance. The regression equation is: = 6.72x + 11.50 and the correlation coefficient was r = 0.781. The data set saw the number of people in attendance ranging from a minimum of 18 people to a maximum of 170 people. 1) How reliable would it be to make a prediction for the concession sales amount if there were 500 people in attendance? Explain.arrow_forwardThe data show The chest size and weight of several bears find regression equation, letting chest size be the independent variable then find the best predicted weight of a bear with a chest size of 51 inches is the result close to the actual weight of 422 pounds use a significance level of 0.05 Chest size : 45, 50, 43, 43, 52, 52. Weight : 352, 374, 275, 314, 440, 367.arrow_forward
- An automobile rental company wants to predict the yearly maintenance expense (Y) for an automobile using the number of miles driven during the year () and the age of the car (, in years) at the beginning of the year. The company has gathered the data on 10 automobiles and run a regression analysis with the results shown below:. Summary measures Multiple R 0.9689 R-Square 0.9387 Adj R-Square 0.9212 StErr of Estimate 72.218 Regression coefficients Coefficient Std Err t-value p-value Constant 33.796 48.181 0.7014 0.5057 Miles Driven 0.0549 0.0191 2.8666 0.0241 Age of car 21.467 20.573 1.0434 0.3314 Use the information above to estimate the annual maintenance expense for a 10 years old car with 60,000 miles.arrow_forwardB b. What does the scatter diagram developed in part (a) indicate about the relationship between the two variables? The scatter diagram indicates a positive linear relationship between a = average number of passing yar and y = the percentage of games won by the team. c. Develop the estimated regression equation that could be used to predict the percentage of games won given the avera passing yards per attempt. Enter negative value as negative number. WinPct =| |)(Yds/Att) (to 4 decimals) d. Provide an interpretation for the slope of the estimated regression equation (to 1 decimal). The slope of the estimated regression line is approximately So, for every increase : of one yar number of passes per attempt, the percentage of games won by the team increases by %. e. For the 2011 season, the average number of passing yards per attempt for the Kansas City Chiefs was was 5.5. Use th regression equation developed in part (c) to predict the percentage of games won by the Kansas City Chiefs.…arrow_forwardA regression was run to determine if there is a relationship between hours of study per week (xx) and the final exam scores (yy).The results of the regression were: y=ax+b a=5.614 b=32.79 r2=0.808201 r=0.899 Use this to predict the final exam score of a student who studies 1 hours per week, and please round your answer to a whole number.arrow_forward
arrow_back_ios
arrow_forward_ios
Recommended textbooks for you
- MATLAB: An Introduction with ApplicationsStatisticsISBN:9781119256830Author:Amos GilatPublisher:John Wiley & Sons Inc
 Probability and Statistics for Engineering and th...StatisticsISBN:9781305251809Author:Jay L. DevorePublisher:Cengage Learning
 Statistics for The Behavioral Sciences (MindTap C...StatisticsISBN:9781305504912Author:Frederick J Gravetter, Larry B. WallnauPublisher:Cengage Learning
  Elementary Statistics: Picturing the World (7th E...StatisticsISBN:9780134683416Author:Ron Larson, Betsy FarberPublisher:PEARSON
 The Basic Practice of StatisticsStatisticsISBN:9781319042578Author:David S. Moore, William I. Notz, Michael A. FlignerPublisher:W. H. Freeman
 Introduction to the Practice of StatisticsStatisticsISBN:9781319013387Author:David S. Moore, George P. McCabe, Bruce A. CraigPublisher:W. H. Freeman
MATLAB: An Introduction with Applications
Statistics
ISBN:9781119256830
Author:Amos Gilat
Publisher:John Wiley & Sons Inc
Probability and Statistics for Engineering and th...
Statistics
ISBN:9781305251809
Author:Jay L. Devore
Publisher:Cengage Learning
Statistics for The Behavioral Sciences (MindTap C...
Statistics
ISBN:9781305504912
Author:Frederick J Gravetter, Larry B. Wallnau
Publisher:Cengage Learning
Elementary Statistics: Picturing the World (7th E...
Statistics
ISBN:9780134683416
Author:Ron Larson, Betsy Farber
Publisher:PEARSON
The Basic Practice of Statistics
Statistics
ISBN:9781319042578
Author:David S. Moore, William I. Notz, Michael A. Fligner
Publisher:W. H. Freeman
Introduction to the Practice of Statistics
Statistics
ISBN:9781319013387
Author:David S. Moore, George P. McCabe, Bruce A. Craig
Publisher:W. H. Freeman