
Chemistry
10th Edition
ISBN: 9781305957404
Author: Steven S. Zumdahl, Susan A. Zumdahl, Donald J. DeCoste
Publisher: Cengage Learning
expand_more
expand_more
format_list_bulleted
Related questions
Question
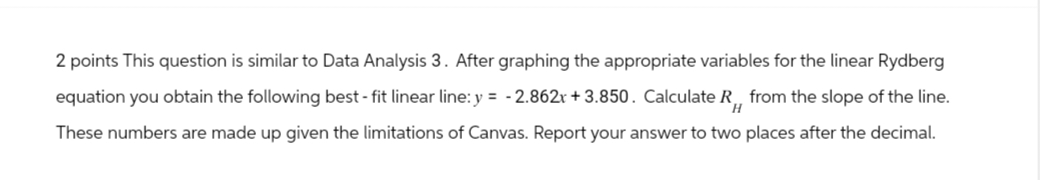

Transcribed Image Text:2 points This question is similar to Data Analysis 3. After graphing the appropriate variables for the linear Rydberg
equation you obtain the following best - fit linear line: y = -2.862x + 3.850. Calculate R from the slope of the line.
These numbers are made up given the limitations of Canvas. Report your answer to two places after the decimal.
H
SAVE
AI-Generated Solution
info
AI-generated content may present inaccurate or offensive content that does not represent bartleby’s views.
Unlock instant AI solutions
Tap the button
to generate a solution
to generate a solution
Click the button to generate
a solution
a solution
Knowledge Booster

Similar questions
- Calculate the frequency of light (in s1 also known as Hz) with a wavelength of (6.00x10^2) nm. Use a value of (3.0000x10^8) for the speed of light. Remember 1 m%3D (1.0000x10^9) nm Do not include units with your answer. Note: Your answer is assumed to be reduced to the highest power possible. Your Answer: х10 Answerarrow_forwardAmateur radio operators in the United States can transmit on several bands. One of those bands consists of radio waves with a wavelength near 15. m . Calculate the frequency of these radio waves. Be sure your answer has the correct number of significant digits.arrow_forwardPlease answer correct.arrow_forward
- Please help me with these Aleks HW questionarrow_forwardUse the References to access important values if needed for this question. A local AM radio station broadcasts at a frequency of 638 kHz. Calculate the wavelength at which it is broadcasting. Wavelength m (1 kHz = 10 sec ) %3D Submit Answerarrow_forwardI need help with A-F pleasearrow_forward
- 1) Listen Find the wavelength (in nm) of a baseball of mass (6.40x10^-1) kg moving at (2.600x10^3) m/s. Answer to 3 significant figures and include the unit. Note: Your answer is assumed to be reduced to the highest power possible. Your Answer: х10 Answer unitsarrow_forwardtab O Electronic Structure Interconverting the wavelength and frequency of electromagnetic... mm NASA communicates with the Space Shuttle and International Space Station using Ku-band microwave radio. Suppose NASA transmits a microwave signal to the Space Shuttle using radio waves with a frequency of 16.GHz. Calculate the wavelength of these radio waves. Round your answer to 2 significant digits. Explanation Esc Type here to search 1 Check Q F1) J 2 x10 F2 W X # 3 F3 5 D E ox F4 $ 4 R F5 % 5 o T DELL F6 A 6 ** F7 Y & NY 7 FB ★ * 00 Ⓒ2023 McGraw Hill LLC. All Rights Reserved. Terms of Use | Privacy Center Accessibilit 12:47 PM 81°F Mostly cloudy 10/27/2023 8 4 F9 ( 1 prt sc F10 9 S home F11 > O O 0/5 6 end Danasia F12 E Insert d deletarrow_forwardAn electrical engineer measures the frequency of a satellite radio transmission. The frequency is 360 GHz. What is the frequency in hertz? Write your answer in scientific notation.arrow_forward
arrow_back_ios
arrow_forward_ios
Recommended textbooks for you
- ChemistryChemistryISBN:9781305957404Author:Steven S. Zumdahl, Susan A. Zumdahl, Donald J. DeCostePublisher:Cengage Learning
 ChemistryChemistryISBN:9781259911156Author:Raymond Chang Dr., Jason Overby ProfessorPublisher:McGraw-Hill Education
 Principles of Instrumental AnalysisChemistryISBN:9781305577213Author:Douglas A. Skoog, F. James Holler, Stanley R. CrouchPublisher:Cengage Learning
  Organic ChemistryChemistryISBN:9780078021558Author:Janice Gorzynski Smith Dr.Publisher:McGraw-Hill Education
 Chemistry: Principles and ReactionsChemistryISBN:9781305079373Author:William L. Masterton, Cecile N. HurleyPublisher:Cengage Learning
 Elementary Principles of Chemical Processes, Bind...ChemistryISBN:9781118431221Author:Richard M. Felder, Ronald W. Rousseau, Lisa G. BullardPublisher:WILEY
Chemistry
Chemistry
ISBN:9781305957404
Author:Steven S. Zumdahl, Susan A. Zumdahl, Donald J. DeCoste
Publisher:Cengage Learning
Chemistry
Chemistry
ISBN:9781259911156
Author:Raymond Chang Dr., Jason Overby Professor
Publisher:McGraw-Hill Education
Principles of Instrumental Analysis
Chemistry
ISBN:9781305577213
Author:Douglas A. Skoog, F. James Holler, Stanley R. Crouch
Publisher:Cengage Learning
Organic Chemistry
Chemistry
ISBN:9780078021558
Author:Janice Gorzynski Smith Dr.
Publisher:McGraw-Hill Education
Chemistry: Principles and Reactions
Chemistry
ISBN:9781305079373
Author:William L. Masterton, Cecile N. Hurley
Publisher:Cengage Learning
Elementary Principles of Chemical Processes, Bind...
Chemistry
ISBN:9781118431221
Author:Richard M. Felder, Ronald W. Rousseau, Lisa G. Bullard
Publisher:WILEY