Advanced Engineering Mathematics
10th Edition
ISBN: 9780470458365
Author: Erwin Kreyszig
Publisher: Wiley, John & Sons, Incorporated
expand_more
expand_more
format_list_bulleted
Question

Transcribed Image Text:#2 of 25-
Jabari
2
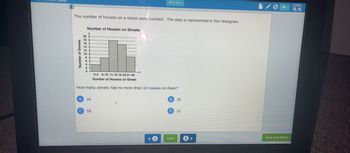
The number of houses on a street were counted. The data is represented in this histogram.
Number of Houses on Streets
Number of Streets
20
18
16
14
12
10
0-5 6-10 11-15 16-20 21-25
Number of Houses on Street
How many streets had no more than 10 houses on them?
A
16
B 25
C
55
D 12
0
<1
Save
3>
Save and Return
100%
Expert Solution
This question has been solved!
Explore an expertly crafted, step-by-step solution for a thorough understanding of key concepts.
Step by stepSolved in 2 steps

Knowledge Booster
Similar questions
- The results for a blood test for a certain disease are shown in the table below. Based on the table, what is the prevalence of the disease? T+ T- Total D+ 290 10 300 D- 3219 481 3700 Total 3509 491 4000 A. 0.09 0.97 O B. 0.0725 290 Screenshotarrow_forwardHelp finding: Lower bound= and Upper Bound = Use this information to interpret the results in terms of the given problem.arrow_forward* Question Completion Status: QUESTION 10 The data in the figure represents the number of stars earned by 140 performers in a talent competition. 35 30 25 20 1 2 3 4 Number of Stars How many performers earned exactly 1 star? Percentage of Performers (N = 140)arrow_forward
- A study was done to look at the relationship between number of movies people watch at the theater each year and the number of books that they read each year. The results of the survey are shown below. Movies 10 7 6 10 0 9 1 6 Books 0 0 -0 0 9 0 9 -0 Use the model to predict the number of books read per year for someone who watches 3 movies per year.Books per year = (Please round your answer to the nearest whole number.) Interpret the slope of the regression line in the context of the question: The slope has no practical meaning since people cannot read a negative number of books. As x goes up, y goes down. For every additional movie that people watch each year, there tends to be an average decrease of 0.98 books read. Interpret the y-intercept in the context of the question: The y-intercept has no practical meaning for this study. If someone watches 0 movies per year, then that person will read 8 books this year. The best prediction for a person who doesn't watch…arrow_forwardR A veterinarian recorded how many kittens were born in each litter. This data is summarized in the L histogram below. (Note: The last class actually represents "7 or more kittens," not just 7 kittens.) 14 12 10- 8- 6- 4 1 2 3 4 7 8 # of kittens What is the frequency of litters having at most 3 kittens? ans = Fe Ro 1 FEB 18 P. W MacBook Air 20 000 esc F5 F6 F2 F3 F4 F1 & ! @ 1 2 4 5 Q W R %24 # 3 6 2. Frequencyarrow_forwardHere is a set of data. 2 41 92 342 353 420 512 551 585 706 776 951 Identify the 5 number summary (min, Q1, median, Q3, max) ___, __, __, __, __arrow_forward
arrow_back_ios
arrow_forward_ios
Recommended textbooks for you
 Advanced Engineering MathematicsAdvanced MathISBN:9780470458365Author:Erwin KreyszigPublisher:Wiley, John & Sons, Incorporated
 Numerical Methods for EngineersAdvanced MathISBN:9780073397924Author:Steven C. Chapra Dr., Raymond P. CanalePublisher:McGraw-Hill Education
 Introductory Mathematics for Engineering Applicat...Advanced MathISBN:9781118141809Author:Nathan KlingbeilPublisher:WILEY
 Mathematics For Machine TechnologyAdvanced MathISBN:9781337798310Author:Peterson, John.Publisher:Cengage Learning,


Advanced Engineering Mathematics
Advanced Math
ISBN:9780470458365
Author:Erwin Kreyszig
Publisher:Wiley, John & Sons, Incorporated

Numerical Methods for Engineers
Advanced Math
ISBN:9780073397924
Author:Steven C. Chapra Dr., Raymond P. Canale
Publisher:McGraw-Hill Education

Introductory Mathematics for Engineering Applicat...
Advanced Math
ISBN:9781118141809
Author:Nathan Klingbeil
Publisher:WILEY

Mathematics For Machine Technology
Advanced Math
ISBN:9781337798310
Author:Peterson, John.
Publisher:Cengage Learning,

