MATLAB: An Introduction with Applications
6th Edition
ISBN: 9781119256830
Author: Amos Gilat
Publisher: John Wiley & Sons Inc
expand_more
expand_more
format_list_bulleted
Topic Video
Question
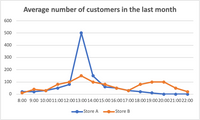
(2) Based on the graph, describe the pattern of customer visits in store A and store B, respectively
(4) If you are a manager from the company headquarters, how would you allocate the personnel resources to store A and store B, respectively

Transcribed Image Text:Average number of customers in the last month
600
500
400
300
200
100
8:00 9:00 10:0011:00 12:0013:0014:0015:00 16:0017:00 18:0019:00 20:0021:0022:00
Store A
Store B
Expert Solution
This question has been solved!
Explore an expertly crafted, step-by-step solution for a thorough understanding of key concepts.
Step by stepSolved in 2 steps

Knowledge Booster
Learn more about
Need a deep-dive on the concept behind this application? Look no further. Learn more about this topic, statistics and related others by exploring similar questions and additional content below.Similar questions
- How can I graph thisarrow_forwardWhat is the equation of this graph?arrow_forwardThe graph to the right shows the number of snow shovels sold in winter months at a store in 2010 and 2011. Number of Snow Shovels Sold a. During which month did the store sell the most snow shovels in 2011? 35- b. During which month did the store sell the fewest show shovels in 2010? 30- c. Based on snow shovel sales, which year, 2010 or 2011, seems to have had the most snow in the store's locale? Why? 25- 20- 15- 2011 2010 10- 5- Month 0+ Nov Dec Jan Feb Mar Number of Shovelsarrow_forward
- The line graph below shows the number of times Maria drove her car each day of the week. How many times did Maria drive her car on day 4?arrow_forwardWhat measures shold be taken when using graphing software?arrow_forwardWhat's the answer for the ones at the bottom based on the graph above?arrow_forward
- 1. Graph y = x and label it "Line A". 2. Graph y = -x+3 and label it "Line B". 3. Graph y=-3 and label it "Line C". %3Darrow_forwardGraph the interaction. On the “Category Axis” box put “maternal diet”. On the “Define Lines by” box put “age. Paste the graph into a word document and upload the file.arrow_forwardQuestion and graph attachedarrow_forward
arrow_back_ios
arrow_forward_ios
Recommended textbooks for you
 MATLAB: An Introduction with ApplicationsStatisticsISBN:9781119256830Author:Amos GilatPublisher:John Wiley & Sons Inc
 Probability and Statistics for Engineering and th...StatisticsISBN:9781305251809Author:Jay L. DevorePublisher:Cengage Learning
 Statistics for The Behavioral Sciences (MindTap C...StatisticsISBN:9781305504912Author:Frederick J Gravetter, Larry B. WallnauPublisher:Cengage Learning
 Elementary Statistics: Picturing the World (7th E...StatisticsISBN:9780134683416Author:Ron Larson, Betsy FarberPublisher:PEARSON
 The Basic Practice of StatisticsStatisticsISBN:9781319042578Author:David S. Moore, William I. Notz, Michael A. FlignerPublisher:W. H. Freeman
 Introduction to the Practice of StatisticsStatisticsISBN:9781319013387Author:David S. Moore, George P. McCabe, Bruce A. CraigPublisher:W. H. Freeman

MATLAB: An Introduction with Applications
Statistics
ISBN:9781119256830
Author:Amos Gilat
Publisher:John Wiley & Sons Inc

Probability and Statistics for Engineering and th...
Statistics
ISBN:9781305251809
Author:Jay L. Devore
Publisher:Cengage Learning

Statistics for The Behavioral Sciences (MindTap C...
Statistics
ISBN:9781305504912
Author:Frederick J Gravetter, Larry B. Wallnau
Publisher:Cengage Learning

Elementary Statistics: Picturing the World (7th E...
Statistics
ISBN:9780134683416
Author:Ron Larson, Betsy Farber
Publisher:PEARSON

The Basic Practice of Statistics
Statistics
ISBN:9781319042578
Author:David S. Moore, William I. Notz, Michael A. Fligner
Publisher:W. H. Freeman

Introduction to the Practice of Statistics
Statistics
ISBN:9781319013387
Author:David S. Moore, George P. McCabe, Bruce A. Craig
Publisher:W. H. Freeman