
MATLAB: An Introduction with Applications
6th Edition
ISBN: 9781119256830
Author: Amos Gilat
Publisher: John Wiley & Sons Inc
expand_more
expand_more
format_list_bulleted
Related questions
Question


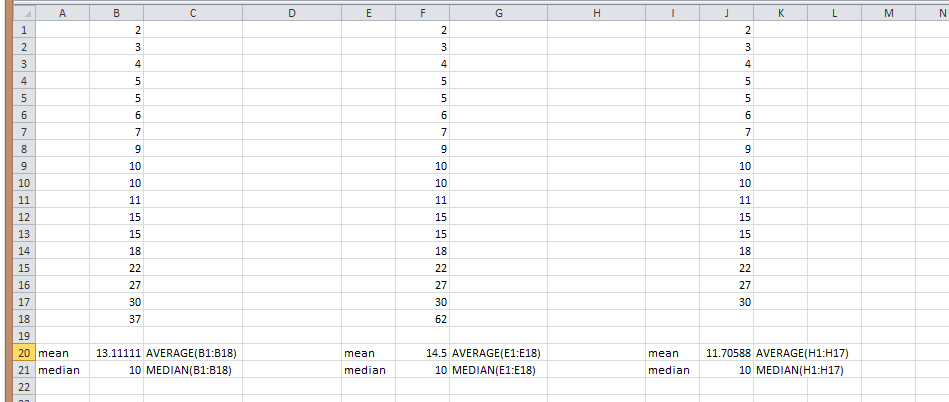
Transcribed Image Text:2, 3, 4, 5, 5, 6, 7, 9, 10, 10, 11, 15, 15, 18, 22, 27, 30, 37
Send data to calculator
Frequency
8.
6.
2.
0
7
8
Send data to Excel
Continue
6
Answer the questions below.
16
Waiting time (in minutes)
(a) For these data, which measures of
central tendency take more than one value?
Choose all that apply.
(b) Suppose that the measurement 37 (the
largest measurement in the data set) were
replaced by 62. Which measures of central
tendency would be affected by the change?
Choose all that apply.
(c) Suppose that, starting with the original
data set, the largest measurement were
removed. Which measures of central
tendency would be changed from those of
the original data set? Choose all that apply.
2
Mean
Median
40
✔Mode
None of these measures
Mean
Median
Mode
None of these measures
Mean
Median
Mode
None of these measures
Expert Solution
arrow_forward
Step 1: using excel we find mean and median

Step by stepSolved in 3 steps with 1 images

Knowledge Booster

Similar questions
- Find the measures of center for following. Data Frequency 40 44 2 45 49 50 54 4 55 59 4 60 64 4 65 - 69 70 - 74 12 13 75 79 16 80 - 84 10 mode = median mean = (round to 4 decimal places)arrow_forwardQUESTION 6 Find the range, mean, median, mode, and standard deviation of the following data set. Round to two decimal pla 18, 17, 19, 15, 9, 18 (a) The range is (b) The mean is (c) The median is (d) The mode is (e) The standard deviation is (Type NO if there is no mode.) (Round to two decimal places)arrow_forward#6 6.2arrow_forward
- Right arm 102 101 94 79 79 Left arm 175 169 182 146 144 If the sample data were to result in the scatterplot shown here, what is the value of the linear correlation coefficient r?arrow_forward5. Which of the following is the assumption that the best way to describe the pattern of data is using a straight line? homoscedasticity normality linearity restriction of rangearrow_forwardI don’t understand what to do with this table.arrow_forward
- The president of a school club would like to purchase T-shirts for members of the club and asks members which size they would like to order. The results are shown in the histogram below. T-Shirt Sizes 24 22 20 18 16 14 Small Medium Large Extra Large Size Which of the following is a true statement regarding the information shown in the histogram? O T-shirt size is a discrete quantitative variable. O T-shirt size is a continuous quantitative variable. O Frequency of each size is a discrete quantitative variable. O T-shirt size is a categorical variable. kouanbesarrow_forwardI need help with this parts a,b, and c pleasearrow_forward
arrow_back_ios
arrow_forward_ios
Recommended textbooks for you
- MATLAB: An Introduction with ApplicationsStatisticsISBN:9781119256830Author:Amos GilatPublisher:John Wiley & Sons Inc
 Probability and Statistics for Engineering and th...StatisticsISBN:9781305251809Author:Jay L. DevorePublisher:Cengage Learning
 Statistics for The Behavioral Sciences (MindTap C...StatisticsISBN:9781305504912Author:Frederick J Gravetter, Larry B. WallnauPublisher:Cengage Learning
  Elementary Statistics: Picturing the World (7th E...StatisticsISBN:9780134683416Author:Ron Larson, Betsy FarberPublisher:PEARSON
 The Basic Practice of StatisticsStatisticsISBN:9781319042578Author:David S. Moore, William I. Notz, Michael A. FlignerPublisher:W. H. Freeman
 Introduction to the Practice of StatisticsStatisticsISBN:9781319013387Author:David S. Moore, George P. McCabe, Bruce A. CraigPublisher:W. H. Freeman
MATLAB: An Introduction with Applications
Statistics
ISBN:9781119256830
Author:Amos Gilat
Publisher:John Wiley & Sons Inc
Probability and Statistics for Engineering and th...
Statistics
ISBN:9781305251809
Author:Jay L. Devore
Publisher:Cengage Learning
Statistics for The Behavioral Sciences (MindTap C...
Statistics
ISBN:9781305504912
Author:Frederick J Gravetter, Larry B. Wallnau
Publisher:Cengage Learning
Elementary Statistics: Picturing the World (7th E...
Statistics
ISBN:9780134683416
Author:Ron Larson, Betsy Farber
Publisher:PEARSON
The Basic Practice of Statistics
Statistics
ISBN:9781319042578
Author:David S. Moore, William I. Notz, Michael A. Fligner
Publisher:W. H. Freeman
Introduction to the Practice of Statistics
Statistics
ISBN:9781319013387
Author:David S. Moore, George P. McCabe, Bruce A. Craig
Publisher:W. H. Freeman