
MATLAB: An Introduction with Applications
6th Edition
ISBN: 9781119256830
Author: Amos Gilat
Publisher: John Wiley & Sons Inc
expand_more
expand_more
format_list_bulleted
Related questions
Concept explainers
Question
(1a) Compute SST, SSR, and SSE. (Round your answers to three decimal places.)
1b) Compute the coefficient of determination r2. (Round your answer to three decimal places.)
1c) What is the value of the sample correlation coefficient ? (Round your answer to three decimal places.)
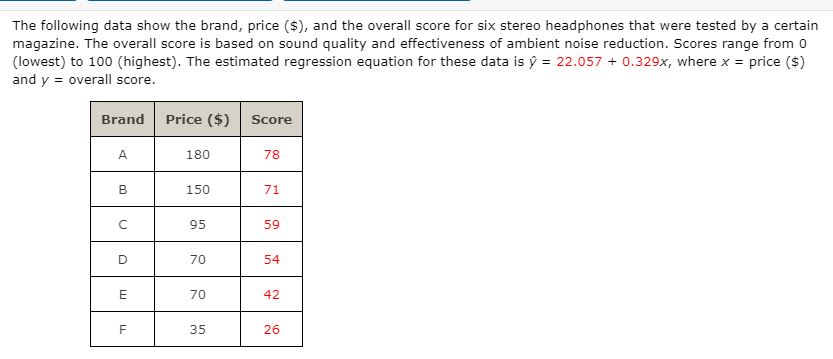

Transcribed Image Text:The following data show the brand, price ($), and the overall score for six stereo headphones that were tested by a certain
magazine. The overall score is based on sound quality and effectiveness of ambient noise reduction. Scores range from 0
(lowest) to 100 (highest). The estimated regression equation for these data is ý = 22.057 + 0.329x, where x = price ($)
and y = overall score.
Brand Price ($)
Score
A
180
78
В
150
71
95
59
70
54
E
70
42
F
35
26
Expert Solution
This question has been solved!
Explore an expertly crafted, step-by-step solution for a thorough understanding of key concepts.

This is a popular solution

Trending nowThis is a popular solution!

Step by stepSolved in 5 steps with 4 images

Knowledge Booster


Learn more about
Need a deep-dive on the concept behind this application? Look no further. Learn more about this topic, statistics and related others by exploring similar questions and additional content below.Similar questions
- I need help with only the blank boxes that need to be filled in with the answer.arrow_forwardThe correlation between midterm and final grades for 300 students is 0.620. If 5 points are added to each midterm grade, the new r will be: a. 0.124 b. 0.57 c. 0.62 d. 0.744arrow_forwardFirst Paired Data Set 4 10 13 11 19 21 36. Use the First Paired Data Set. Find the correlation coefficient r. A. 0.862 B. 0.943 C. 0.725 D. 0.607arrow_forward
- urgen pleasearrow_forwardThe correlation coefficient between variables X and Y is 0.62. What does this signify? Question 8Answer a. When Y increases 1, X increases by 0.62 b. When X increases by 1, Y increases by 0.62 c. The variance shared by X and Y is less 20% d. The variance shared by X and Y is 62%arrow_forwardSuppose we measure the heights (in inches) and weights (in pounds) of 100 randomly chosen college students. Furthermore suppose we calculate the correlation to be 0.6. If we change the measurements to centimeters and kilograms, what happens to the value of the correlation? Note: There are 2.54 centimeters in an inch, and there are 2.2 pounds in a kilogram. Group of answer choices: A. The correlation increases by a factor of 2.54/2.2 B. The correlation is still 0.6. C. The correlation decreases by a factor of 2.2. D. The correlation increases by a factor of 2.54.arrow_forward
arrow_back_ios
arrow_forward_ios
Recommended textbooks for you
- MATLAB: An Introduction with ApplicationsStatisticsISBN:9781119256830Author:Amos GilatPublisher:John Wiley & Sons Inc
 Probability and Statistics for Engineering and th...StatisticsISBN:9781305251809Author:Jay L. DevorePublisher:Cengage Learning
 Statistics for The Behavioral Sciences (MindTap C...StatisticsISBN:9781305504912Author:Frederick J Gravetter, Larry B. WallnauPublisher:Cengage Learning
  Elementary Statistics: Picturing the World (7th E...StatisticsISBN:9780134683416Author:Ron Larson, Betsy FarberPublisher:PEARSON
 The Basic Practice of StatisticsStatisticsISBN:9781319042578Author:David S. Moore, William I. Notz, Michael A. FlignerPublisher:W. H. Freeman
 Introduction to the Practice of StatisticsStatisticsISBN:9781319013387Author:David S. Moore, George P. McCabe, Bruce A. CraigPublisher:W. H. Freeman
MATLAB: An Introduction with Applications
Statistics
ISBN:9781119256830
Author:Amos Gilat
Publisher:John Wiley & Sons Inc
Probability and Statistics for Engineering and th...
Statistics
ISBN:9781305251809
Author:Jay L. Devore
Publisher:Cengage Learning
Statistics for The Behavioral Sciences (MindTap C...
Statistics
ISBN:9781305504912
Author:Frederick J Gravetter, Larry B. Wallnau
Publisher:Cengage Learning
Elementary Statistics: Picturing the World (7th E...
Statistics
ISBN:9780134683416
Author:Ron Larson, Betsy Farber
Publisher:PEARSON
The Basic Practice of Statistics
Statistics
ISBN:9781319042578
Author:David S. Moore, William I. Notz, Michael A. Fligner
Publisher:W. H. Freeman
Introduction to the Practice of Statistics
Statistics
ISBN:9781319013387
Author:David S. Moore, George P. McCabe, Bruce A. Craig
Publisher:W. H. Freeman