Essentials Of Investments
11th Edition
ISBN: 9781260013924
Author: Bodie, Zvi, Kane, Alex, MARCUS, Alan J.
Publisher: Mcgraw-hill Education,
expand_more
expand_more
format_list_bulleted
Question

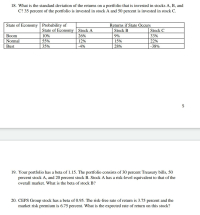
Transcribed Image Text:18. What is the standard deviation of the returns on a portfolio that is invested in stocks A, B, and
C? 35 percent of the portfolio is invested in stock A and 50 percent is invested in stock C.
State of Economy Probability of
Returns if State Occurs
State of Economy | Stock A
Stock B
Stock C
Boom
10%
26%
9%
33%
Normal
55%
12%
15%
22%
Bust
35%
-4%
28%
-38%
Expert Solution
This question has been solved!
Explore an expertly crafted, step-by-step solution for a thorough understanding of key concepts.
This is a popular solution
Trending nowThis is a popular solution!
Step by stepSolved in 2 steps with 5 images

Knowledge Booster
Learn more about
Need a deep-dive on the concept behind this application? Look no further. Learn more about this topic, finance and related others by exploring similar questions and additional content below.Similar questions
- Accounting Use the following information: Stock A B Good state 12% 17% Bad state 0% -1% Assume there is 60% probability that the good state occurs and 40% chance the bad state occurs. What is the expected return of a portfolio that is 9% invested in stock A and 1-9% invested in B? (Please use 5 decimal places, this should be written in percentage return, so an answer of 23.143% should be written at .23143)arrow_forwardBased on this image, how many stocks does it take to eliminate most of the diversifiable risk?arrow_forwardConsider the following data State of Nature Prob. Stock A Return Boom 0.3 16.00% Normal 0.6 14.20% Recession 0.1 8.00% What is the expected return for Stock A? Group of answer choices 14.12% 12.14% 15.12% 14.00%arrow_forward
- Problem 1. The following are estimates for two stocks. Firm-Specific Standard Deviation 25% 40 Stock Expected Return Beta 7% A 0.90 1.30 B 11 The market index has a standard deviation of 24% and the risk-free rate is 4%. a) What are the standard deviations of stocks A and B? b) Suppose we build a portfolio with the following weights: 50% in stock A, 40% in stock B, and 10% in risk- free T-bills. Compute the expected return, standard deviation, beta, and nonsystematic standard deviation of the portfolioarrow_forwardff2arrow_forward5 Assume the historical volatility of a stock on the S&P 500 is 50% and the correlation between the returns of stock is 30% A. What is the average variance of stocks on the S&P? B. What is the average covariance of the stocks? C. Consider a portfolio of S&P stocks. What is the estimated volatility of the portfolio when there 10 stocks in the portfolio? What about 20 stocks in the portfolio?arrow_forward
arrow_back_ios
arrow_forward_ios
Recommended textbooks for you
 Essentials Of InvestmentsFinanceISBN:9781260013924Author:Bodie, Zvi, Kane, Alex, MARCUS, Alan J.Publisher:Mcgraw-hill Education,

 Foundations Of FinanceFinanceISBN:9780134897264Author:KEOWN, Arthur J., Martin, John D., PETTY, J. WilliamPublisher:Pearson,
 Fundamentals of Financial Management (MindTap Cou...FinanceISBN:9781337395250Author:Eugene F. Brigham, Joel F. HoustonPublisher:Cengage Learning
 Corporate Finance (The Mcgraw-hill/Irwin Series i...FinanceISBN:9780077861759Author:Stephen A. Ross Franco Modigliani Professor of Financial Economics Professor, Randolph W Westerfield Robert R. Dockson Deans Chair in Bus. Admin., Jeffrey Jaffe, Bradford D Jordan ProfessorPublisher:McGraw-Hill Education

Essentials Of Investments
Finance
ISBN:9781260013924
Author:Bodie, Zvi, Kane, Alex, MARCUS, Alan J.
Publisher:Mcgraw-hill Education,


Foundations Of Finance
Finance
ISBN:9780134897264
Author:KEOWN, Arthur J., Martin, John D., PETTY, J. William
Publisher:Pearson,

Fundamentals of Financial Management (MindTap Cou...
Finance
ISBN:9781337395250
Author:Eugene F. Brigham, Joel F. Houston
Publisher:Cengage Learning

Corporate Finance (The Mcgraw-hill/Irwin Series i...
Finance
ISBN:9780077861759
Author:Stephen A. Ross Franco Modigliani Professor of Financial Economics Professor, Randolph W Westerfield Robert R. Dockson Deans Chair in Bus. Admin., Jeffrey Jaffe, Bradford D Jordan Professor
Publisher:McGraw-Hill Education