
A First Course in Probability (10th Edition)
10th Edition
ISBN: 9780134753119
Author: Sheldon Ross
Publisher: PEARSON
expand_more
expand_more
format_list_bulleted
Related questions
Question
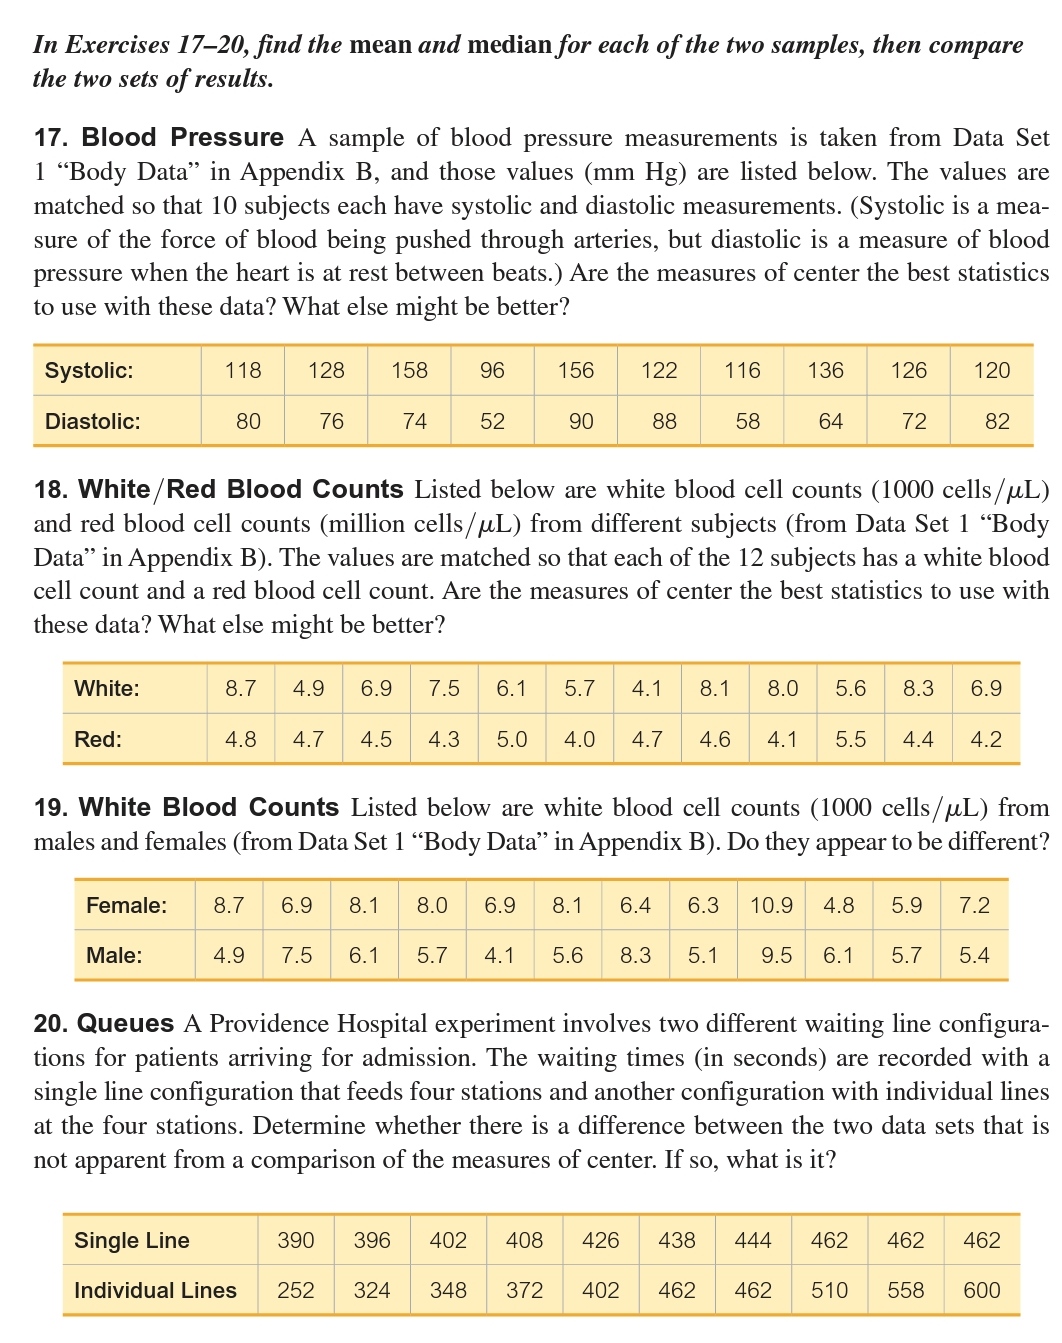

Transcribed Image Text:In Exercises 17-20, find the mean and median for each of the two samples, then compare
the two sets of results.
17. Blood Pressure A sample of blood pressure measurements is taken from Data Set
1 "Body Data" in Appendix B, and those values (mm Hg) are listed below. The values are
matched so that 10 subjects each have systolic and diastolic measurements. (Systolic is a mea-
sure of the force of blood being pushed through arteries, but diastolic is a measure of blood
pressure when the heart is at rest between beats.) Are the measures of center the best statistics
to use with these data? What else might be better?
Systolic:
Diastolic:
White:
Red:
118 128 158
80
Male:
76
74
Female: 8.7 6.9 8.1
4.9 7.5 6.1
96
52
Single Line
Individual Lines
156
90
18. White/Red Blood Counts Listed below are white blood cell counts (1000 cells/μL)
and red blood cell counts (million cells/μL) from different subjects (from Data Set 1 "Body
Data" in Appendix B). The values are matched so that each of the 12 subjects has a white blood
cell count and a red blood cell count. Are the measures of center the best statistics to use with
these data? What else might be better?
5.7 4.1
122
88
390 396 402 408
252 324 348 372
116 136 126 120
8.7 4.9 6.9 7.5 6.1
5.7 4.1 8.1 8.0 5.6 8.3 6.9
4.8 4.7 4.5 4.3 5.0 4.0 4.7 4.6 4.1 5.5 4.4 4.2
19. White Blood Counts Listed below are white blood cell counts (1000 cells/μL) from
males and females (from Data Set 1 "Body Data" in Appendix B). Do they appear to be different?
58
64
402
72
426 438
8.0 6.9 8.1 6.4 6.3 10.9 4.8 5.9 7.2
5.6 8.3 5.1 9.5 6.1 5.7 5.4
82
20. Queues A Providence Hospital experiment involves two different waiting line configura-
tions for patients arriving for admission. The waiting times (in seconds) are recorded with a
single line configuration that feeds four stations and another configuration with individual lines
at the four stations. Determine whether there is a difference between the two data sets that is
not apparent from a comparison of the measures of center. If so, what is it?
444 462 462 462
462 462 510 558
600
Expert Solution
This question has been solved!
Explore an expertly crafted, step-by-step solution for a thorough understanding of key concepts.

This is a popular solution

Trending nowThis is a popular solution!

Step by stepSolved in 5 steps with 4 images

Knowledge Booster

Similar questions
- 4. A new method for cholesterol utilizing 4 - aminoantipyrine was evaluated in the laboratory. The procedure was run in on 20 separate days. The following values are given: Mean = 150 mg/dl Sum of the squared difference from the mean is 3600 Calculate the SD.arrow_forward3] Provide an example of a qualitative variable. You may not use an example provided in th notes.arrow_forwardShortleaf Pines. The ability to estimate the volume of a tree based on a simple measurement, such as the diameter of the tree, is important to the lumber industry, ecologists, and conservationists. Data on volume, in cubic feet, and diameter at breast height, in inches, for 70 shortleaf pines was reported in C. Bruce and F. X. Schumacher’s Forest Mensuration (New York: McGraw-Hill, 1935) and analyzed by A. C. Akinson in the article “Transforming Both Sides of a Tree” (The American Statistician, Vol. 48, pp. 307–312). The data are provided on the WeissStats site. a. obtain and interpret the standard error of the estimate. b. obtain a residual plot and a normal probability plot of the residuals. c. decide whether you can reasonably consider Assumptions 1–3 for regression inferences met by the two variables under consideration.arrow_forward
- Normal text Calibri BIUA 10 2 |II 3 I. 4 1) Freeze Inc. is an air conditioning company located in Lakeland, Florida. They collected data for the number of air conditioning units sold in the Central Florida area and for the outside temperature on the day that sales took place. The Sales Manager put the following table together: Outside Temperature Sales (Degrees F) (Number of air conditioning units sold). 68 4 72 78 8 81 10 84 14 86 15 89 21 91 20 93 22 94 25 Plot a scatter diagram for the data provided on the table above and the linear regression line calculated in topic (b). Consider that: Y: number of air conditioning units sold X: outside temperature (degrees F) Guidance: graph should look like the one presented in Figure 4.2 of textbook. Graph plotted by MS Excel, as a result of the Regression function will not be accepted. a) Perform the linear regression calculation and provide the linear regression equation that describes the relationship between Y (number of air conditioning…arrow_forwardCan you help me with d?arrow_forwardListed below are pulse rates (beats per minute) from samples of adult males and females. Does there appear to be adifference? Find the coefficient of variation for each of the two samples; then compare the variation. A. The coefficient of variation for the male pulse rates iS (Type an integer or decimal rounded to one decimal place as needed.) B. The coefficient of variation for the female pulse rates is (Type an integer or decimal rounded to one decimal place as needed.)arrow_forward
arrow_back_ios
arrow_forward_ios
Recommended textbooks for you
- A First Course in Probability (10th Edition)ProbabilityISBN:9780134753119Author:Sheldon RossPublisher:PEARSON

A First Course in Probability (10th Edition)
Probability
ISBN:9780134753119
Author:Sheldon Ross
Publisher:PEARSON