MATLAB: An Introduction with Applications
6th Edition
ISBN: 9781119256830
Author: Amos Gilat
Publisher: John Wiley & Sons Inc
expand_more
expand_more
format_list_bulleted
Topic Video
Question

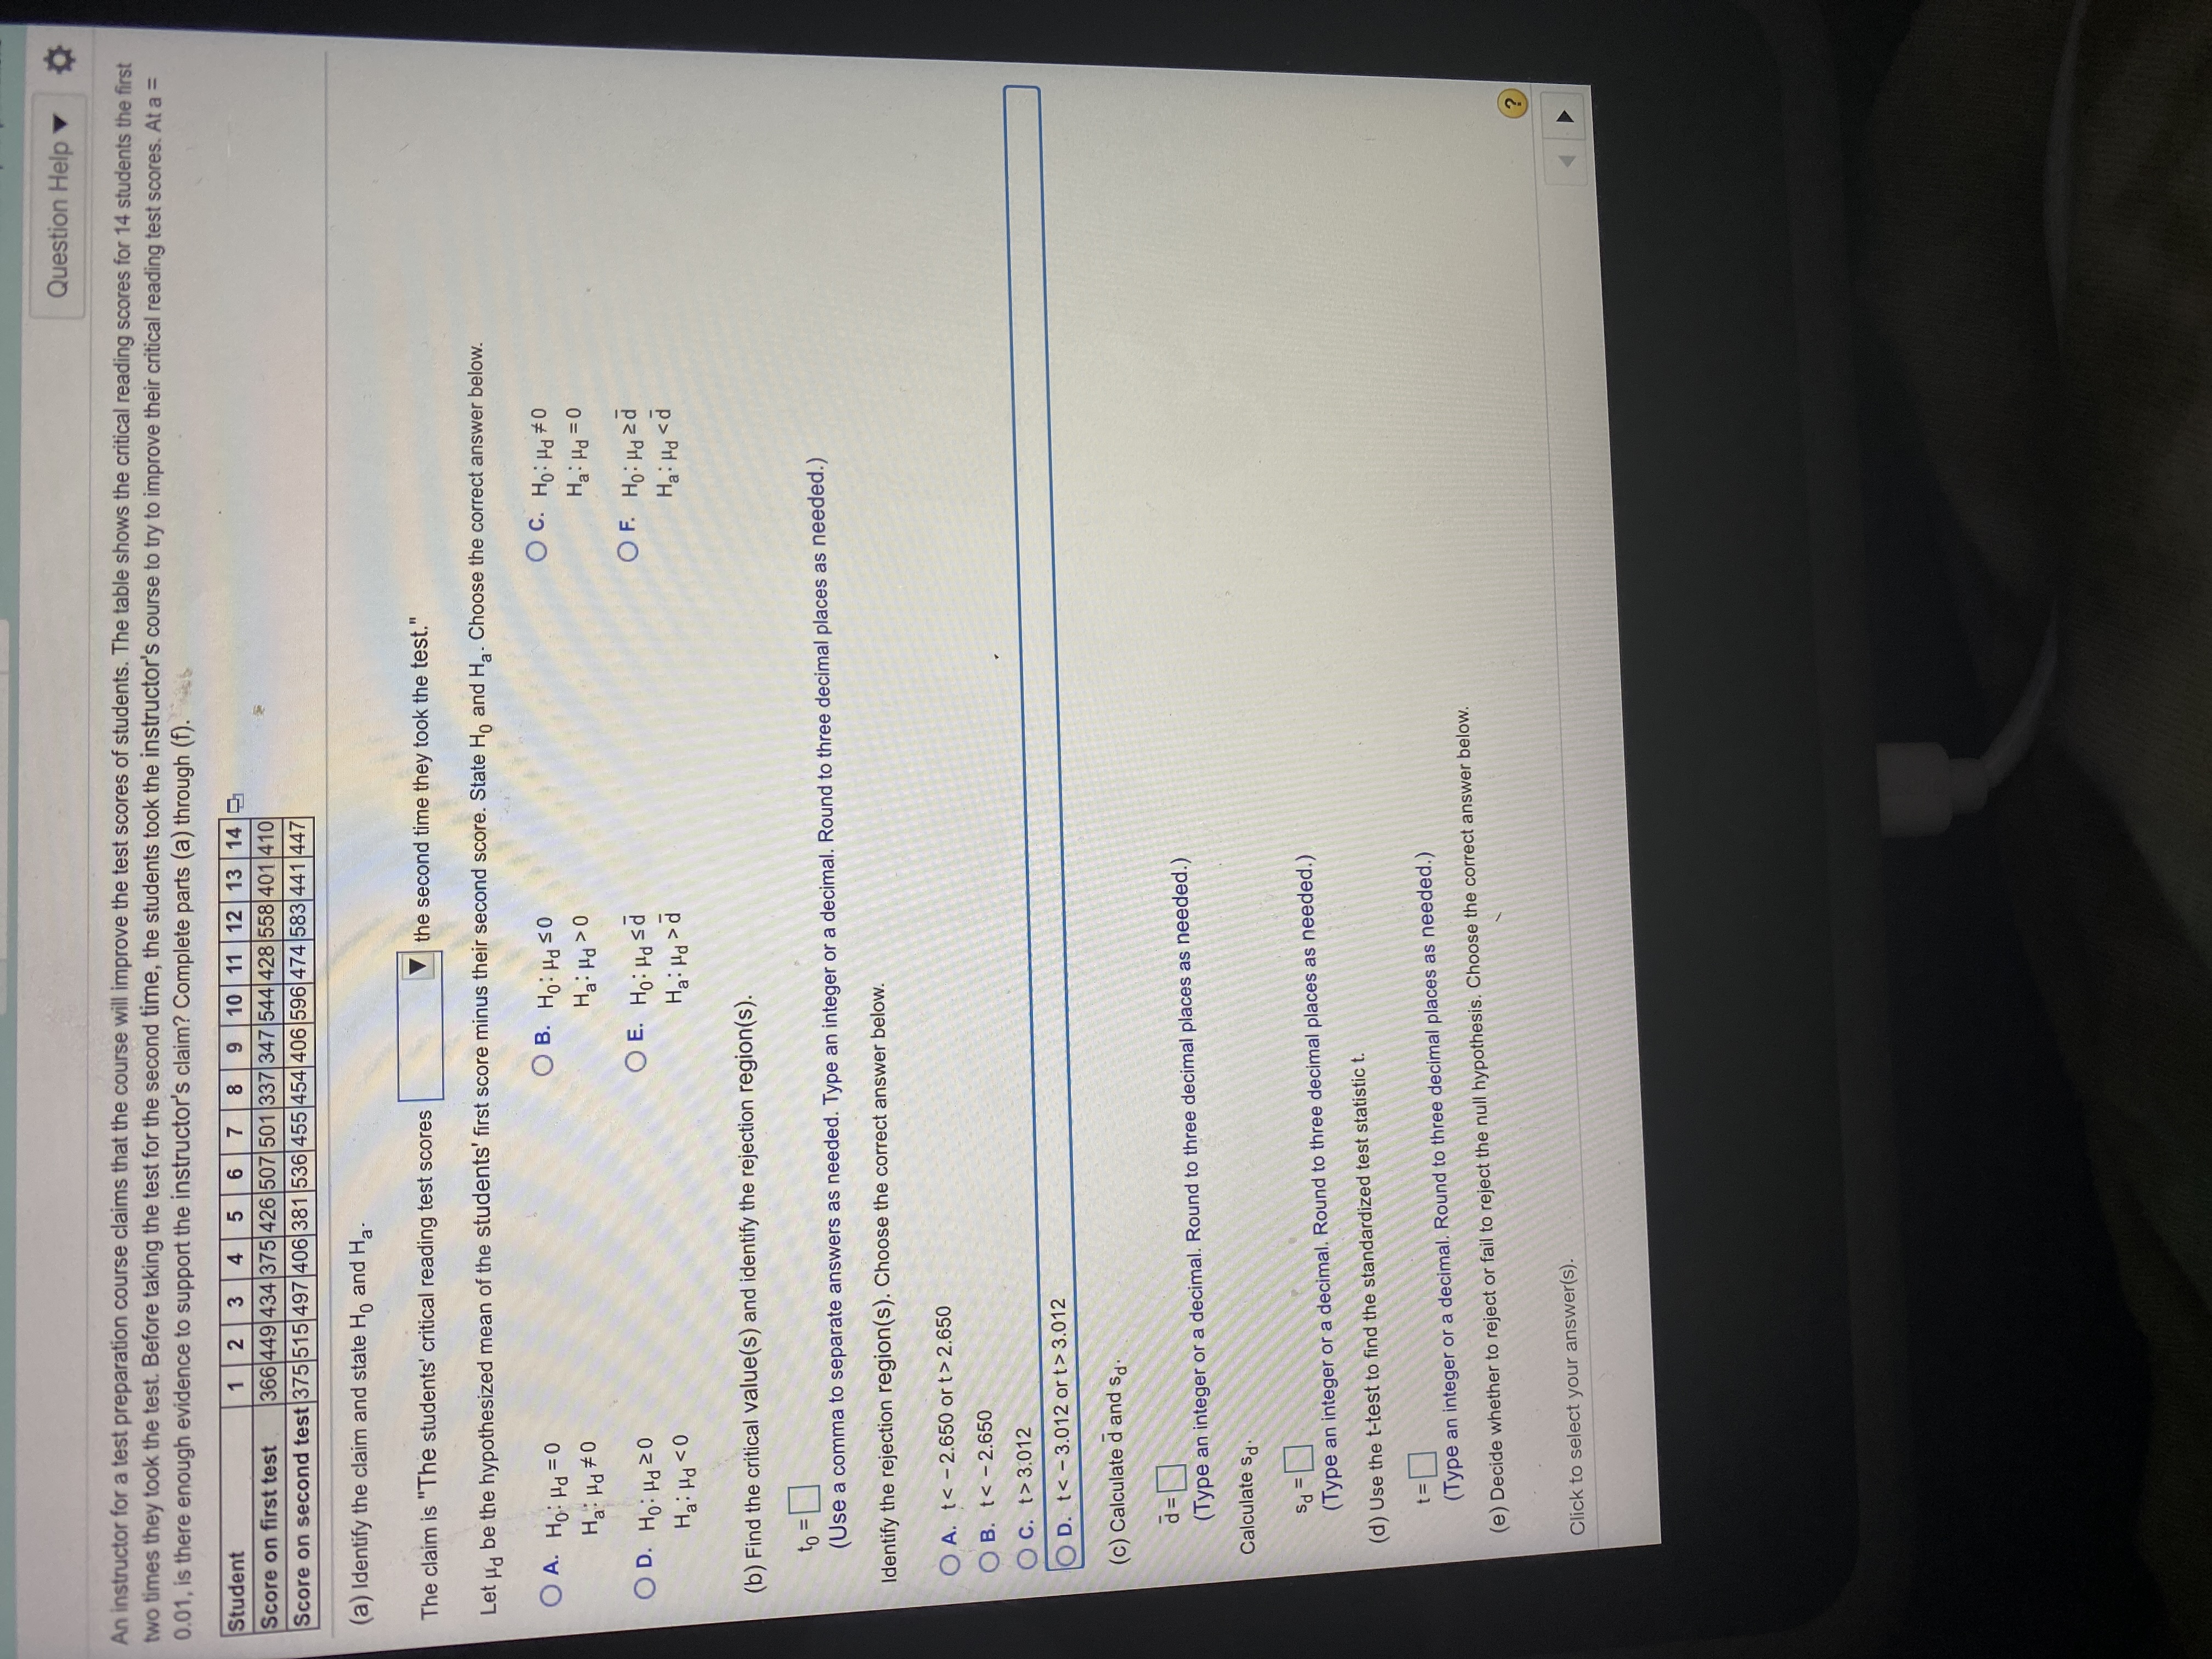
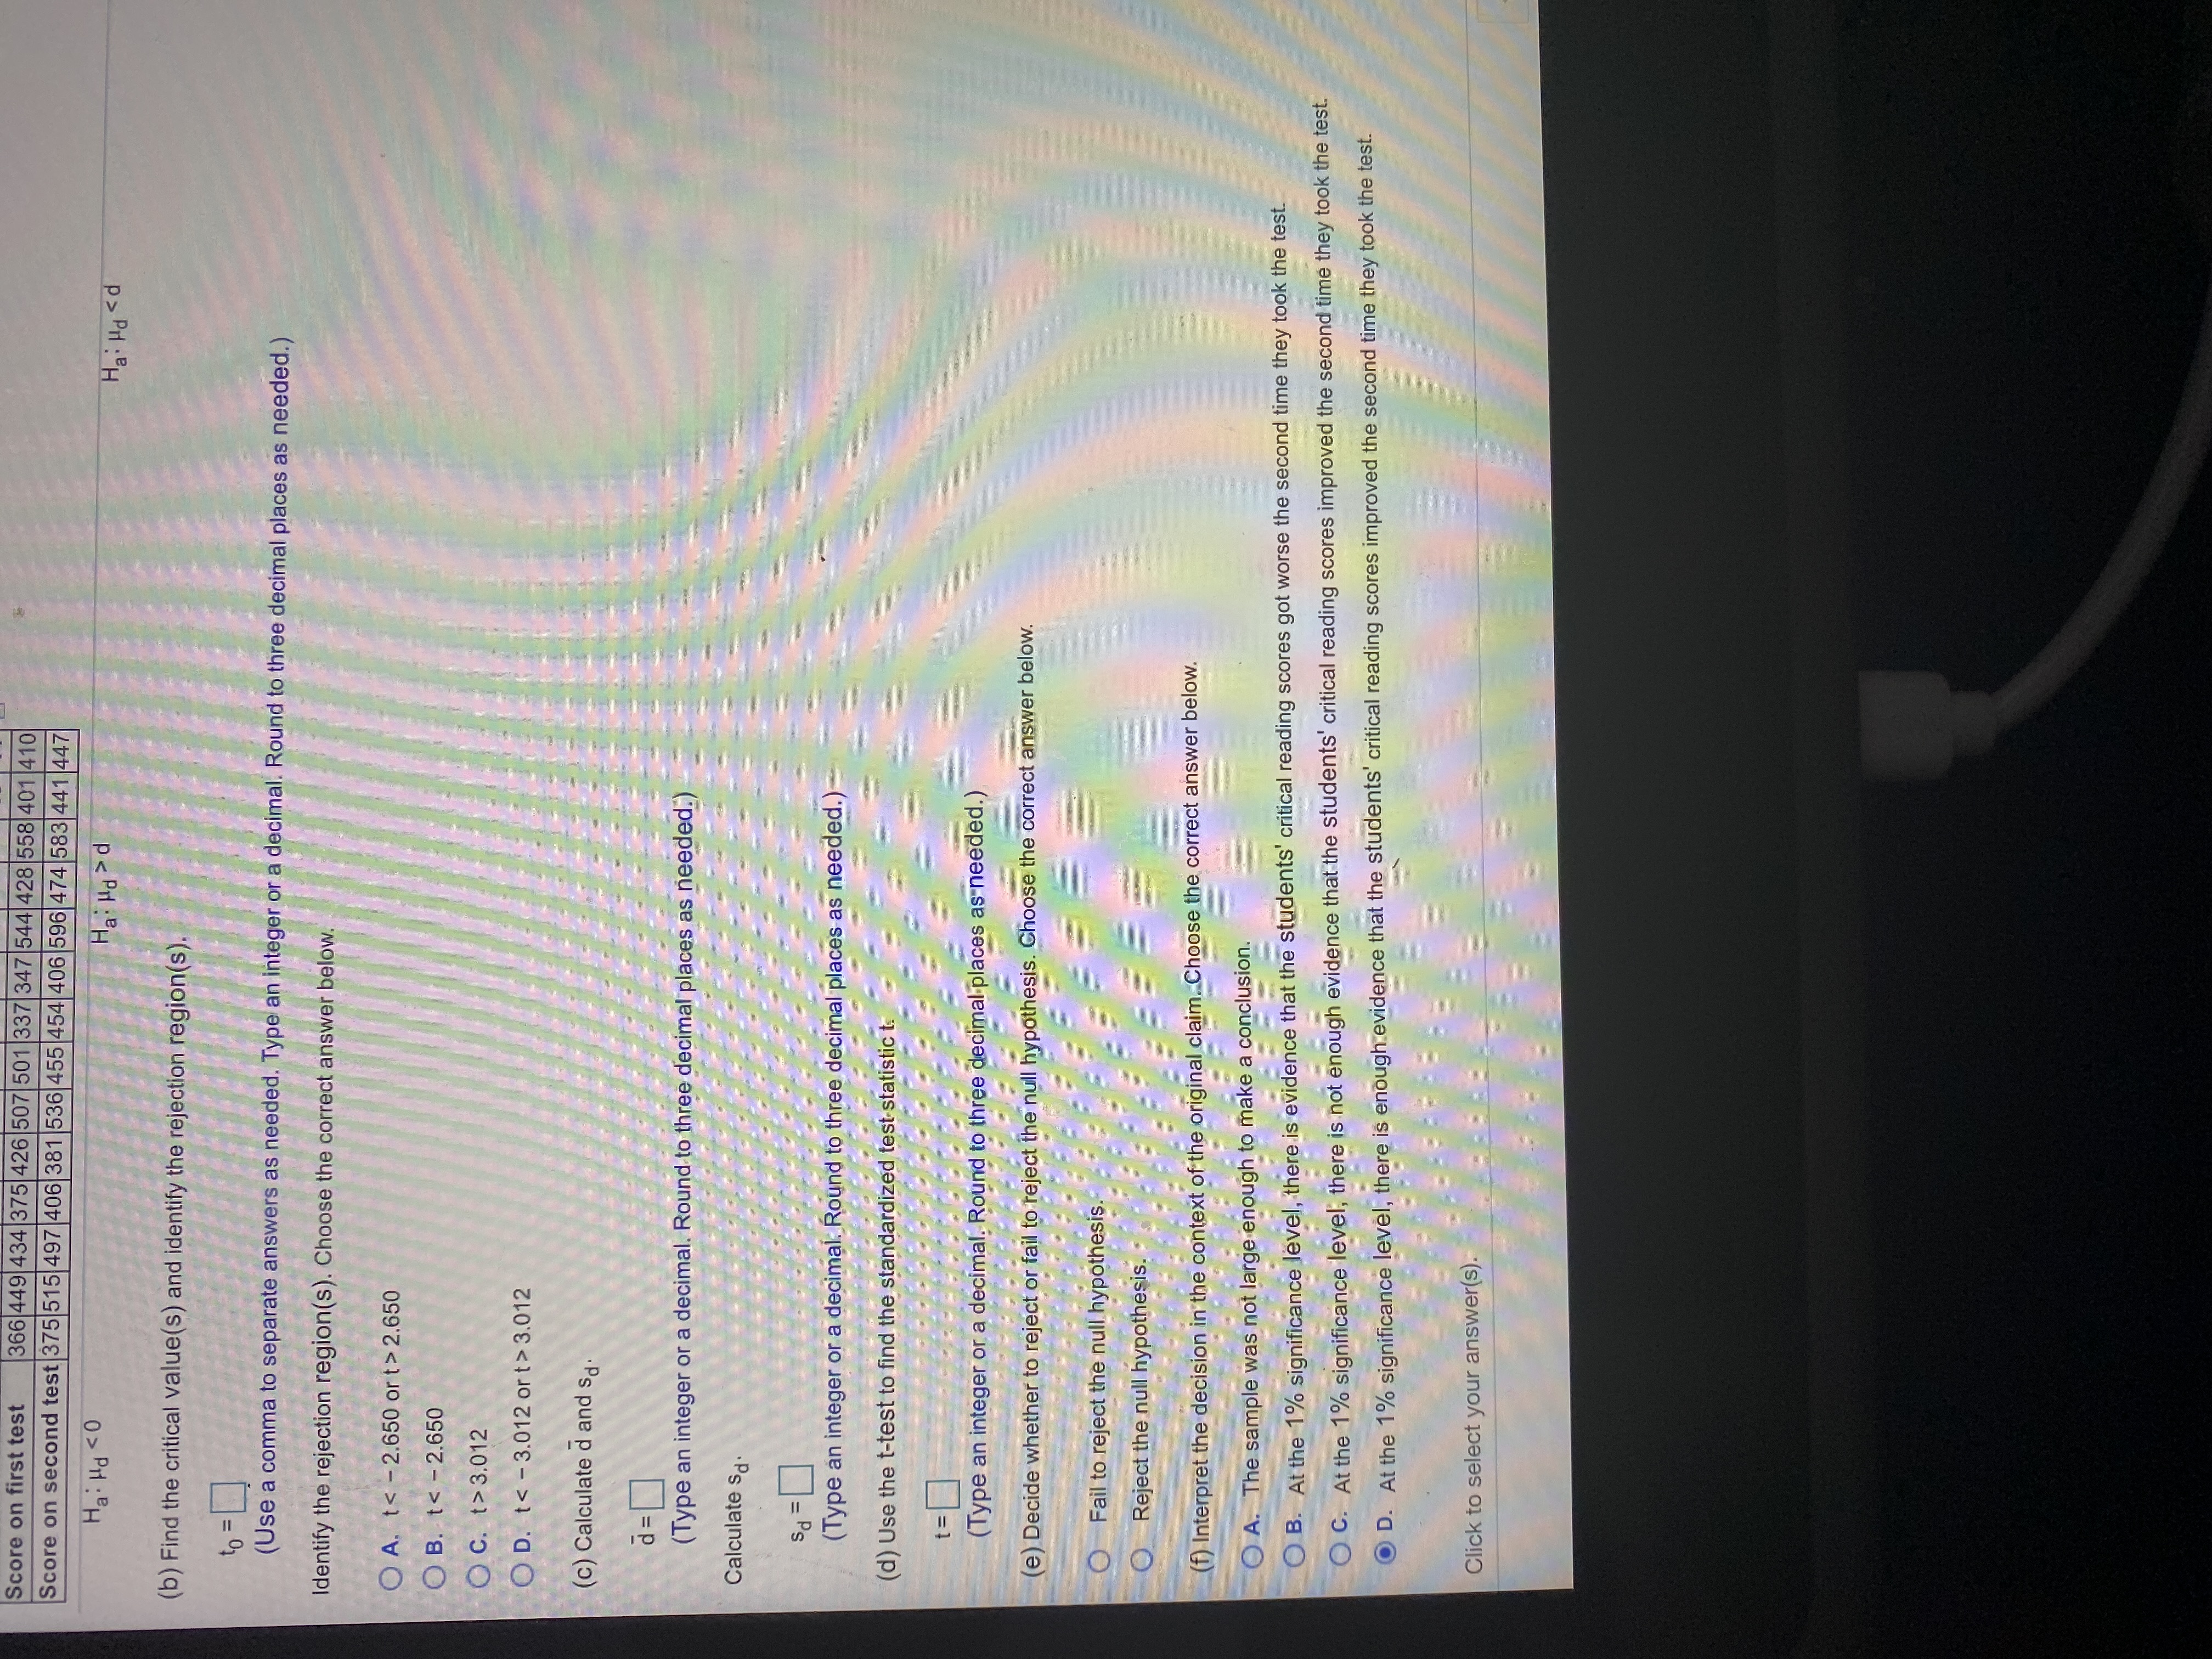
Transcribed Image Text:An instructor for a test preparation course claims that the course will improve the test scores of students. The table shows the critical reading scores for 14 students the first
two times they took the test. Before taking the test for the second time, the students took the instructor's course to try to improve their critical reading test scores. At a =
0.01, is there enough evidence to support the instructor's claim? Complete parts (a) through (f).
Student
1
2
3
4
7
8
10 11 12 13 14
Score on first test
366 449 434375 426 507501 337 347544 428 558 401 410
Score on second test 375515 497 406 381 536 455454 406 596 474 583 441 447

Expert Solution
This question has been solved!
Explore an expertly crafted, step-by-step solution for a thorough understanding of key concepts.
This is a popular solution
Trending nowThis is a popular solution!
Step by stepSolved in 3 steps

Knowledge Booster
Learn more about
Need a deep-dive on the concept behind this application? Look no further. Learn more about this topic, statistics and related others by exploring similar questions and additional content below.Similar questions
- Click the icon to view the table of Chi-Square critical values. Construct a 90% confidence interval for the population standard deviation a at Bank A. 0.40 minarrow_forwardThe stem-and-leaf display below gives the test scores for the students in Prof. Ramirez's 10 a.m. and 11 10 a.m. class and 23 students in the 11 a.m. class. Use the display to answer the questions that follow. Test scores for Prof. Ramirez's economics classes 10 a.m. 11 a.m. 9 87 425 8632 589 7775551 06002489 9 854 7 4 55 679 78025578 95 Key: 47 + - 7|4 |2 42 (a) What were the ranges for the two classes? 10 a.m. 11 a.m. (b) Which class had the higher median score? o10 a.m. o11 a.m. OThe medians were the same (c) Which class had more scores in the 50s? 10 a.m. o11 a.m. OEach had the samearrow_forwardThe values listed below are waiting times (in minutes) of customers at two different banks. At Bank A, customers enter a single waiting line that feeds three teller windows. At Bank B, customers may enter any one of three different lines that have formed at three teller windows. Answer the following questions. Bank A 6.4 6.6 6.7 6.8 7.1 7.3 7.5 7.7 7.7 7.7 Bank B 4.2 5.5 5.7 6.2 6.7 7.8 7.8 8.5 9.3 10.0 Click the icon to view the table of Chi-Square critical values. Construct a 95% confidence interval for the population standard deviation o at Bank A. min< OBank A min (Round two decimal places as needed.) Construct a 95% confidence interval for the population standard deviation o at Bank B. min < OBank B < min (Round to two decimal places as needed.) Interpret the results found in the previous parts. Do the confidence intervals suggest a difference in the variation among waiting times? Does the single-line system or the multiple-line system seem to be a better arrangement? O A. The…arrow_forwardB₁ is an estimator of B₁ a. True O b. Falsearrow_forwardwants to know if it is better for Instructor Pilots to give flight students feedback in the airplane immediately after each maneuver rather than to wait till they are on the ground and debriefing. Six student pilots are selected. Each student receives immediate feedback on half of their flights and receives delayed (after landing) feedback on the other half of their flights. Average scores for the student’s evaluations are listed in the table below. Show work. Student Pilot Score for Immediate Feedback Score for Feedback Received After on the Ground Student Pilot A 4 2 Student Pilot B 3 4 Student Pilot C 5 2 Student Pilot D 3 3 Student Pilot E 5 3 Student Pilot F 5 2 a. Test the hypothesis that the student pilots receive higher evaluations on flights where they received immediate feedback compared to delayed (after landing) feedback. Use α =.05. Use the four steps of hypothesis testing. b. Calculate Omega squared (ώ2)arrow_forwardWould love three help. Q9arrow_forwardRead the passage of Prefer Pain and answer the questions carefully to get the correct answers.arrow_forwardBasketball Scores In a Physical Education (P.E) class, the teacher wanted to work on basketball skills and game development over a five week period. The P.E. teacher prepared a table showing the points scored by five players during this time. 1. What is the value of x? II. What is the value of y? Ben Sienna Dexter Avi Rayner Range Game 1 4 8 5 8 12 8 Game 2 11 13 8 13 16 8 Game 3 9 4 6 5 25 21 Game 4 7 16 13 20 4 Game 5 14 10 3 17 23 20 Mean for student 9 X 7 12.6 16arrow_forwardThe values listed below are waiting times (in minutes) of customers at two different banks. At Bank A, customers enter a single waiting line that feeds three teller windows. At Bank B, customers may enter any one of three different lines that have formed at three teller windows. Answer the following questions. Bank A 6.3 4.3 6.6 7.0 7.0 Bank B 5.4 5.8 6.1 6.8 78 8.5 10.0 A Click the icon to view the table of Chi-Square critical values. Construct a 95% confidence interval for the population standard deviation a at Bank A O minarrow_forwarda.Consider the two variables, High School GPA and Average Annual Earnings in Adulthood. Which isdependent?b. Describe the relationship between High School GPA and Average Annual Earnings in Adulthood. Is thecorrelation positive or negative? (Write at least two sentences.)c. Does a person’s High School GPA cause them to earn a certain salary in adulthood? Explain.arrow_forwardLisa's scores on tests for the assessment class are 93, 89, 87, and 83. She needs an 89.5 average to obtain an "A" in the class. Assuming that all tests, including the final, are equally weighted, what score must she obtain on the final exam to earn an "A"? CA Vimsi larrow_forwardPlease help with these three parts. ? Thank you!arrow_forwardarrow_back_iosarrow_forward_iosRecommended textbooks for you
 MATLAB: An Introduction with ApplicationsStatisticsISBN:9781119256830Author:Amos GilatPublisher:John Wiley & Sons Inc
 Probability and Statistics for Engineering and th...StatisticsISBN:9781305251809Author:Jay L. DevorePublisher:Cengage Learning
 Statistics for The Behavioral Sciences (MindTap C...StatisticsISBN:9781305504912Author:Frederick J Gravetter, Larry B. WallnauPublisher:Cengage Learning
 Elementary Statistics: Picturing the World (7th E...StatisticsISBN:9780134683416Author:Ron Larson, Betsy FarberPublisher:PEARSON
 The Basic Practice of StatisticsStatisticsISBN:9781319042578Author:David S. Moore, William I. Notz, Michael A. FlignerPublisher:W. H. Freeman
 Introduction to the Practice of StatisticsStatisticsISBN:9781319013387Author:David S. Moore, George P. McCabe, Bruce A. CraigPublisher:W. H. Freeman
 MATLAB: An Introduction with ApplicationsStatisticsISBN:9781119256830Author:Amos GilatPublisher:John Wiley & Sons Inc
 Probability and Statistics for Engineering and th...StatisticsISBN:9781305251809Author:Jay L. DevorePublisher:Cengage Learning
 Statistics for The Behavioral Sciences (MindTap C...StatisticsISBN:9781305504912Author:Frederick J Gravetter, Larry B. WallnauPublisher:Cengage Learning
 Elementary Statistics: Picturing the World (7th E...StatisticsISBN:9780134683416Author:Ron Larson, Betsy FarberPublisher:PEARSON
 The Basic Practice of StatisticsStatisticsISBN:9781319042578Author:David S. Moore, William I. Notz, Michael A. FlignerPublisher:W. H. Freeman
 Introduction to the Practice of StatisticsStatisticsISBN:9781319013387Author:David S. Moore, George P. McCabe, Bruce A. CraigPublisher:W. H. Freeman