
MATLAB: An Introduction with Applications
6th Edition
ISBN: 9781119256830
Author: Amos Gilat
Publisher: John Wiley & Sons Inc
expand_more
expand_more
format_list_bulleted
Related questions
Question
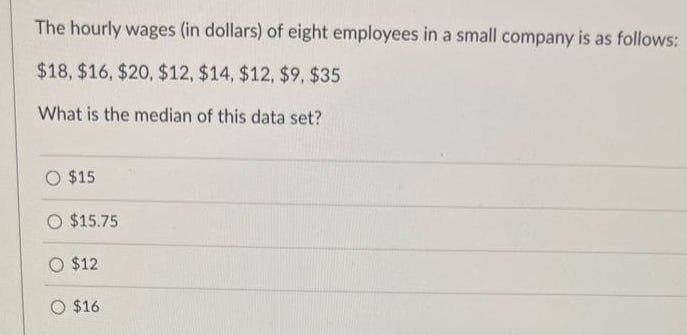

Transcribed Image Text:The hourly wages (in dollars) of eight employees in a small company is as follows:
$18, $16, $20, $12, $14, $12, $9, $35
What is the median of this data set?
O $15
O $15.75
O $12
O $16.
Expert Solution
This question has been solved!
Explore an expertly crafted, step-by-step solution for a thorough understanding of key concepts.

Step by stepSolved in 3 steps with 2 images

Knowledge Booster

Similar questions
- Find the 5 number summary for the data shown. 1 11 25 29 45 50 60 70 73 84 94 97 100 5 number summary:arrow_forwardGiven the following data set: $1.42, $1.27, $1.28, $1.48, $1.36, $1.44, $1.46, $1.32, $1.33, $1.33 $1.23, $1.38, $1.43, $1.28, $1.43, $1.49, $1.37, $1.26, $1.26, $1.38 Determine the frequencies of gasoline prices for each given class. Frequency Relative Frequency Class < $1.25 $1.25 < $1.30 $1.30 $1.35 $1.35 $1.40 $1.40 < $1.45 $1.45 CHECK ANSWERarrow_forwardAt the Carnival game, there are three 1 dollar bills, one 5 dollar bill, and one 10 dollar bill in a bag. It's five dollars to play, and whichever bill you grab from the bag is the one you keep. Say you draw 20 times with the following data: $5, $1, $1, $10, $1, $1, $5, $1, $1, $5, $10, $1, $1, $1, $1, $5, $1, $1, $10, $5 What is the expected value?arrow_forward
- Find the mode of the data set: 13, 32, 25, 27, 13 O 22 O 13 O 24.5 O 25 Eo search F3 F4 F5 F6 F7 F8 F9 2$ % &arrow_forwardAfter giving a statistics exam, professor Dang determined the following five-number summary for her class results: 60 68 77 89 98. Use this information to draw a box plot of the exam scoresarrow_forwardA jar contains 6 red marbles numbered 1 to 6 and 12 blue marbles numbered 1 to 12. A marble is drawn at random from the jar. Find the probability of the given event. (a) The marble is red Your answer is: (b) The marble is odd-numbered Your answer is: (c) The marble is red or odd-numbered Your answer is: tab (d) The marble is blue and even-numbered Your answer is: Question Help: Video Message instructor Submit Question esc 1 ! 80 A F1 F2 F3 F4 F5 F6 F7 8 2 Q W #3 ヨ St 4 A S D lock % <6 olo 5 R T Y & 7 LL F G Harrow_forward
- The following chart provides data that is widespread. Use this data to answer questions 11 through 14. Ages: 25 41 33 42 28 31 35 41 22 0. 27 23 34 40 38 38 28 25arrow_forwardDescribe the shape of the data presented: Number of students 10 9 8 87 3 2 1 0 0 Hours Spent Playing Video Games on Weekends 5 10 15 20 25arrow_forwardThe Acme Company manufactures widgets. The distribution of widget weights is bell-shaped. The widget weights have a mean of 40 ounces and a standard deviation of 10 ounces. Use the Standard Deviation Rule, also known as the Empirical Rule. Suggestion: sketch the distribution in order to answer these questions. a) 99.7% of the widget weights lie between and b) What percentage of the widget weights lie between 20 and 70 ounces? c) What percentage of the widget weights lie above 30 ? Question Help: Video Message instructor %arrow_forward
- A student was interested in the cigarette-smoking habits of college students and collected data from an unbiased random sample of students. The data are summarized in the following table. Males who smoke Males who do not smoke Females who smoke Females who do not smoke What type of chart best represents the relative class frequencies? Multiple Choice Pie chart Box plot Frequency polygon 10 40 15 60 Scatterplotarrow_forwardB?arrow_forwardFind the five-number summary for the following data set. 55, 60, 63, 74, 88, 96, 98, 106, 107, 110arrow_forward
arrow_back_ios
SEE MORE QUESTIONS
arrow_forward_ios
Recommended textbooks for you
- MATLAB: An Introduction with ApplicationsStatisticsISBN:9781119256830Author:Amos GilatPublisher:John Wiley & Sons Inc
 Probability and Statistics for Engineering and th...StatisticsISBN:9781305251809Author:Jay L. DevorePublisher:Cengage Learning
 Statistics for The Behavioral Sciences (MindTap C...StatisticsISBN:9781305504912Author:Frederick J Gravetter, Larry B. WallnauPublisher:Cengage Learning
  Elementary Statistics: Picturing the World (7th E...StatisticsISBN:9780134683416Author:Ron Larson, Betsy FarberPublisher:PEARSON
 The Basic Practice of StatisticsStatisticsISBN:9781319042578Author:David S. Moore, William I. Notz, Michael A. FlignerPublisher:W. H. Freeman
 Introduction to the Practice of StatisticsStatisticsISBN:9781319013387Author:David S. Moore, George P. McCabe, Bruce A. CraigPublisher:W. H. Freeman
MATLAB: An Introduction with Applications
Statistics
ISBN:9781119256830
Author:Amos Gilat
Publisher:John Wiley & Sons Inc
Probability and Statistics for Engineering and th...
Statistics
ISBN:9781305251809
Author:Jay L. Devore
Publisher:Cengage Learning
Statistics for The Behavioral Sciences (MindTap C...
Statistics
ISBN:9781305504912
Author:Frederick J Gravetter, Larry B. Wallnau
Publisher:Cengage Learning
Elementary Statistics: Picturing the World (7th E...
Statistics
ISBN:9780134683416
Author:Ron Larson, Betsy Farber
Publisher:PEARSON
The Basic Practice of Statistics
Statistics
ISBN:9781319042578
Author:David S. Moore, William I. Notz, Michael A. Fligner
Publisher:W. H. Freeman
Introduction to the Practice of Statistics
Statistics
ISBN:9781319013387
Author:David S. Moore, George P. McCabe, Bruce A. Craig
Publisher:W. H. Freeman