
MATLAB: An Introduction with Applications
6th Edition
ISBN: 9781119256830
Author: Amos Gilat
Publisher: John Wiley & Sons Inc
expand_more
expand_more
format_list_bulleted
Related questions
Question
Answer this question CORRECTLY!
Answer choices:
A. 0
B. 1
C. -1
D. 0.5
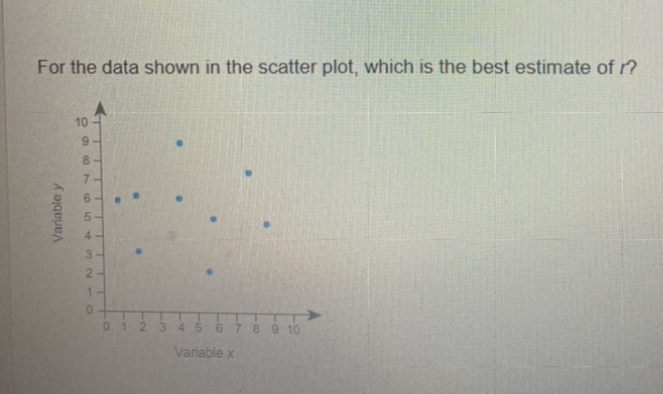

Transcribed Image Text:For the data shown in the scatter plot, which is the best estimate of r?
Variable y
898
10
7
6
S
32
2
1-
0
0 1 2 3 4 5 6 7 8 9 10
Variable x
Expert Solution
This question has been solved!
Explore an expertly crafted, step-by-step solution for a thorough understanding of key concepts.

This is a popular solution

Trending nowThis is a popular solution!

Step by stepSolved in 3 steps

Knowledge Booster

Similar questions
- Admission to a baseball game is $3.00$3.00 for general admission and $7.00$7.00 for reserved seats. The receipts were $5224.00$5224.00 for 12801280 paid admissions. How many of each ticket were sold?arrow_forwardThe possible answers are: a. 314.56 b. 388.77 c. 126.87 d. 225.56arrow_forwardThe formula in cell A2 is =B$4+$C5 and is copied to B3. What will the formula in B3 be? Group of answer choices =C$4+$C5 =B$4+$D5 =B$4+$C6 =C$4+$C6arrow_forward
- d) Greyhound and Trailways travel from San Francisco to Los Angeles. Trailways makes the trip in 7 hours, while Greyhound takes 8.5 hours. If the average speed of the Greyhound bus is 10 miles per hour less than the Trailways bus, find the average speed of each bus. Round to the nearest tenth.arrow_forwardWhat is CD?arrow_forwardJett’s car gets about 30 miles to the gallon. Suppose he drives about 15,000 miles each year and gas costs an average of $3.75 per gallon. How much money will Jett spend on gas in a year? $1,905 $1,875 $1,810 $1,750arrow_forward
arrow_back_ios
arrow_forward_ios
Recommended textbooks for you
- MATLAB: An Introduction with ApplicationsStatisticsISBN:9781119256830Author:Amos GilatPublisher:John Wiley & Sons Inc
 Probability and Statistics for Engineering and th...StatisticsISBN:9781305251809Author:Jay L. DevorePublisher:Cengage Learning
 Statistics for The Behavioral Sciences (MindTap C...StatisticsISBN:9781305504912Author:Frederick J Gravetter, Larry B. WallnauPublisher:Cengage Learning
  Elementary Statistics: Picturing the World (7th E...StatisticsISBN:9780134683416Author:Ron Larson, Betsy FarberPublisher:PEARSON
 The Basic Practice of StatisticsStatisticsISBN:9781319042578Author:David S. Moore, William I. Notz, Michael A. FlignerPublisher:W. H. Freeman
 Introduction to the Practice of StatisticsStatisticsISBN:9781319013387Author:David S. Moore, George P. McCabe, Bruce A. CraigPublisher:W. H. Freeman
MATLAB: An Introduction with Applications
Statistics
ISBN:9781119256830
Author:Amos Gilat
Publisher:John Wiley & Sons Inc
Probability and Statistics for Engineering and th...
Statistics
ISBN:9781305251809
Author:Jay L. Devore
Publisher:Cengage Learning
Statistics for The Behavioral Sciences (MindTap C...
Statistics
ISBN:9781305504912
Author:Frederick J Gravetter, Larry B. Wallnau
Publisher:Cengage Learning
Elementary Statistics: Picturing the World (7th E...
Statistics
ISBN:9780134683416
Author:Ron Larson, Betsy Farber
Publisher:PEARSON
The Basic Practice of Statistics
Statistics
ISBN:9781319042578
Author:David S. Moore, William I. Notz, Michael A. Fligner
Publisher:W. H. Freeman
Introduction to the Practice of Statistics
Statistics
ISBN:9781319013387
Author:David S. Moore, George P. McCabe, Bruce A. Craig
Publisher:W. H. Freeman