MATLAB: An Introduction with Applications
6th Edition
ISBN: 9781119256830
Author: Amos Gilat
Publisher: John Wiley & Sons Inc
expand_more
expand_more
format_list_bulleted
Question

Transcribed Image Text:times a cat re
haped
m to their food
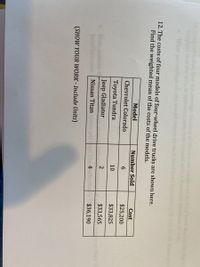
12. The costs of four models of four-wheel drive trucks are shown here.
Find the weighted mean of the costs of the models.
Model
Number Sold
Cost
Chevrolet Colorado
6.
$25,200
Toyota Tundra
10
$33,825
Jeep Gladiator
$33,565
ret
New
to their
Nissan Titan
4
$36,190
(SHOW YOUR WORK - Include Units)
Expert Solution
This question has been solved!
Explore an expertly crafted, step-by-step solution for a thorough understanding of key concepts.
Step by stepSolved in 2 steps

Knowledge Booster
Learn more about
Need a deep-dive on the concept behind this application? Look no further. Learn more about this topic, statistics and related others by exploring similar questions and additional content below.Similar questions
- Find the 5 number summary for the data shown. 2 3 9. 26 43 46 68 72 86 87| 92 95 number summary: N 5arrow_forwardSolve c through harrow_forwardThe top 14 speeds, in miles per hour, for professional drag racing over the past two decades are listed below. Find the median speed. 181.1 202.2 190.1 201.4 201.2 193.2 201.2 194.5 A. 196.1 B. 196.7 C. 201.2 D. 195.8 191.3 201.4 199.2 192.2 196.0 196.2arrow_forward
- The highway mileage (mpg) for a sample of 10 different models of a car company can be found below. 45 29 29 22 48 20 24 41 21 28 Find the mode: Find the midrange: Find the range:arrow_forwardUse this dataset for your analysis software. Cost-to-charge ratio (the percentage of the amount billed that represents the actual cost) for inpatient and outpatient services at 11 Oregon hospitals is shown in the following table. A scatterplot of the data is also shown. Hospital 1 2 3 O No 4 5 6 7 8 9 10 11 No No 100 90 80 70 60 50 Cost-to-Charge Ratio Outpatient Inpatient Care Care 45 62 66 63 51 75 65 56 45 48 71 54 å Inpatient 55 80 76 75 62 100 88 64 50 54 83 100 65 Outpatient The least-squares regression line with y = inpatient cost-to-charge ratio and x = outpatient cost-to-charge ratio is ý = -1.1 + 1.29 x. (a) Is the observation for Hospital 11 an influential observation? Yes (b) Is the observation for Hospital 11 an outlier? Yes 75 (c) Is the observation for Hospital 5 an influential observation? O Yes O No (d) Is the observation for Hospital 5 an outlier? O Yes O Noarrow_forwardIn a month where the price of eggs is above average, would you expect the price of milk to be above average or below average? Explain.arrow_forward
- The frequencies of traffic fatalities of nonoccupants of vehicles are shown in the following bar chart. Change this to a bar chart of relative frequencies.arrow_forwardListed below are the numbers of hurricanes that occurred in each year in a certain region. The data are listed in order by year. Find the range, variance, and standard deviation for the given sample data. Include appropriate units in the results. What important feature of the data is not revealed by any of the measures of variation? 9 12 20 12 The range of the sample data is (Round to one decimal place as needed.) The standard deviation of the sample data is (Round to one decimal place as needed.) The variance of the sample data is (Round to one decimal place as needed.) 5 9 16 3 What impactant fasturn of the data is not enunaled through the different m 5 16 variation 4 11 16 12 Darrow_forwardyour car is more crowded than you think. table 5.8 reports results from a 1969 personal transportation survey on "home-to-work" trips in metropolitan areas. The survey stated that the average car occupancy was 1.4 people. check that calculation.arrow_forward
arrow_back_ios
arrow_forward_ios
Recommended textbooks for you
 MATLAB: An Introduction with ApplicationsStatisticsISBN:9781119256830Author:Amos GilatPublisher:John Wiley & Sons Inc
 Probability and Statistics for Engineering and th...StatisticsISBN:9781305251809Author:Jay L. DevorePublisher:Cengage Learning
 Statistics for The Behavioral Sciences (MindTap C...StatisticsISBN:9781305504912Author:Frederick J Gravetter, Larry B. WallnauPublisher:Cengage Learning
 Elementary Statistics: Picturing the World (7th E...StatisticsISBN:9780134683416Author:Ron Larson, Betsy FarberPublisher:PEARSON
 The Basic Practice of StatisticsStatisticsISBN:9781319042578Author:David S. Moore, William I. Notz, Michael A. FlignerPublisher:W. H. Freeman
 Introduction to the Practice of StatisticsStatisticsISBN:9781319013387Author:David S. Moore, George P. McCabe, Bruce A. CraigPublisher:W. H. Freeman

MATLAB: An Introduction with Applications
Statistics
ISBN:9781119256830
Author:Amos Gilat
Publisher:John Wiley & Sons Inc

Probability and Statistics for Engineering and th...
Statistics
ISBN:9781305251809
Author:Jay L. Devore
Publisher:Cengage Learning

Statistics for The Behavioral Sciences (MindTap C...
Statistics
ISBN:9781305504912
Author:Frederick J Gravetter, Larry B. Wallnau
Publisher:Cengage Learning

Elementary Statistics: Picturing the World (7th E...
Statistics
ISBN:9780134683416
Author:Ron Larson, Betsy Farber
Publisher:PEARSON

The Basic Practice of Statistics
Statistics
ISBN:9781319042578
Author:David S. Moore, William I. Notz, Michael A. Fligner
Publisher:W. H. Freeman

Introduction to the Practice of Statistics
Statistics
ISBN:9781319013387
Author:David S. Moore, George P. McCabe, Bruce A. Craig
Publisher:W. H. Freeman