
MATLAB: An Introduction with Applications
6th Edition
ISBN: 9781119256830
Author: Amos Gilat
Publisher: John Wiley & Sons Inc
expand_more
expand_more
format_list_bulleted
Related questions
Question
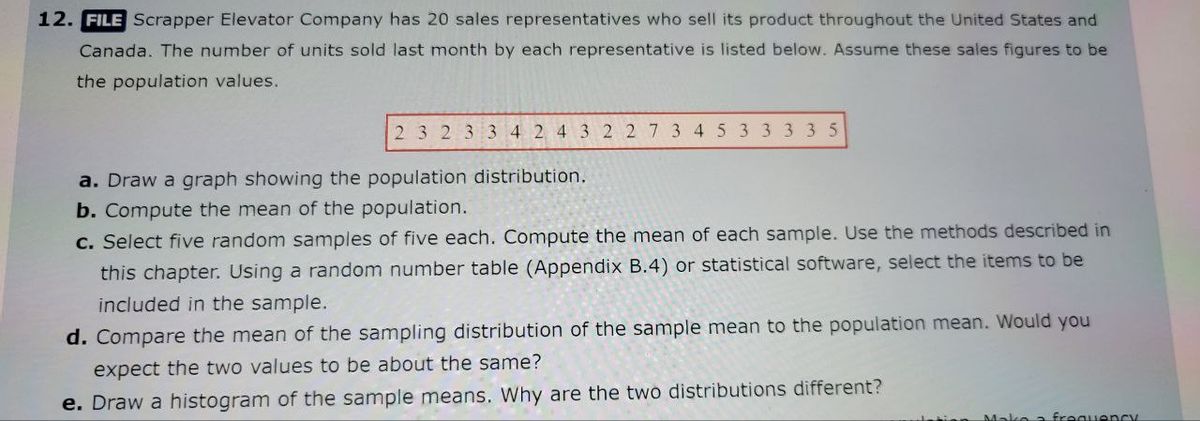

Transcribed Image Text:12. FILE Scrapper Elevator Company has 20 sales representatives who sell its product throughout the United States and
Canada. The number of units sold last month by each representative is listed below. Assume these sales figures to be
the population values.
2 3 2 3 3 4 2 4 3 2 2 7 3 4 5 3 3 3 3 5
a. Draw a graph showing the population distribution.
b. Compute the mean of the population.
c. Select five random samples of five each. Compute the mean of each sample. Use the methods described in
this chapter. Using a random number table (Appendix B.4) or statistical software, select the items to be
included in the sample.
d. Compare the mean of the sampling distribution of the sample mean to the population mean. Would you
expect the two values to be about the same?
e. Draw a histogram of the sample means. Why are the two distributions different?
requency
Expert Solution
This question has been solved!
Explore an expertly crafted, step-by-step solution for a thorough understanding of key concepts.

Step by stepSolved in 2 steps with 2 images

Knowledge Booster

Similar questions
- 2arrow_forwardThe manager of Hudson Auto Repair would like to get a better picture of the distribution of costs for new parts used in the engine tune-up jobs done in the garage. A sample of 50 customer invoices for tune-ups has been taken and the costs of parts, rounded to the nearest dollar, are listed below. 91 78 93 57 75 52 99 80 73 62 71 69 72 89 66 75 79 75 72 76 104 74 62 68 97 105 77 65 80 109 85 97 88 68 83 68 71 69 67 74 62 82 98 101 79 105 79 69 62 73 Develop a frequency distribution for these cost data. Use your own judgment to determine the number of classes and class width that provide a distribution that will be meaningful and helpful to the manager. a. Develop a stem-and-leaf display showing both the rank order and shape of the data set. (3) b. Develop a stretched stem-and-leaf display using two stems for each leading digit(s). (2) c. Which display is better at revealing the natural grouping and variation in the data? (1)arrow_forwardYou decide that you want to make sure your estimate from part a is correct. You go out and gather 10 simple random samples of 25 people in your school and calculate the proportion of students within each sample whose Amazon packages arrive within two business days of ordering. The proportion of customers that receive their packages within two days of ordering are given below. 0.70, 0.75, 0.6, 0.95, 0.90, 0.73, 0.87, 0.86, 0.92, 0.97 Explain why all of the sample proportions are not the same.arrow_forward
- The average final exam score for the statistics course is 43%. A professor wants to see if the average final exam score for students who are given colored pens on the first day of class is larger. The final exam scores for the 19 randomly selected students who were given the colored pens are shown below. Assume that the distribution of the population is normal. 54, 38, 45, 47, 42, 42, 48, 38, 56, 51, 46, 41, 43, 41, 37, 40, 53, 43, 43 Copy to clipboard What can be concluded at the = 0.05 level of the significance? a. For this study, we should use Select an answer b. The null and alternative hypotheses would be: Ho: ? Select an answer H1: ? Select an answer c. The test statistic ? v (please show your answer to 3 decimal places.)arrow_forwardThe following data give the number of keyboards assembled at the Twentieth Century Electronics Company for a sample of 25 days. Calculate the following: 1st Decile, 28th Percentile, 7th Decile, and 85th Percentile.arrow_forward
arrow_back_ios
arrow_forward_ios
Recommended textbooks for you
- MATLAB: An Introduction with ApplicationsStatisticsISBN:9781119256830Author:Amos GilatPublisher:John Wiley & Sons Inc
 Probability and Statistics for Engineering and th...StatisticsISBN:9781305251809Author:Jay L. DevorePublisher:Cengage Learning
 Statistics for The Behavioral Sciences (MindTap C...StatisticsISBN:9781305504912Author:Frederick J Gravetter, Larry B. WallnauPublisher:Cengage Learning
  Elementary Statistics: Picturing the World (7th E...StatisticsISBN:9780134683416Author:Ron Larson, Betsy FarberPublisher:PEARSON
 The Basic Practice of StatisticsStatisticsISBN:9781319042578Author:David S. Moore, William I. Notz, Michael A. FlignerPublisher:W. H. Freeman
 Introduction to the Practice of StatisticsStatisticsISBN:9781319013387Author:David S. Moore, George P. McCabe, Bruce A. CraigPublisher:W. H. Freeman
MATLAB: An Introduction with Applications
Statistics
ISBN:9781119256830
Author:Amos Gilat
Publisher:John Wiley & Sons Inc
Probability and Statistics for Engineering and th...
Statistics
ISBN:9781305251809
Author:Jay L. Devore
Publisher:Cengage Learning
Statistics for The Behavioral Sciences (MindTap C...
Statistics
ISBN:9781305504912
Author:Frederick J Gravetter, Larry B. Wallnau
Publisher:Cengage Learning
Elementary Statistics: Picturing the World (7th E...
Statistics
ISBN:9780134683416
Author:Ron Larson, Betsy Farber
Publisher:PEARSON
The Basic Practice of Statistics
Statistics
ISBN:9781319042578
Author:David S. Moore, William I. Notz, Michael A. Fligner
Publisher:W. H. Freeman
Introduction to the Practice of Statistics
Statistics
ISBN:9781319013387
Author:David S. Moore, George P. McCabe, Bruce A. Craig
Publisher:W. H. Freeman