
MATLAB: An Introduction with Applications
6th Edition
ISBN: 9781119256830
Author: Amos Gilat
Publisher: John Wiley & Sons Inc
expand_more
expand_more
format_list_bulleted
Related questions
Concept explainers
Question

Transcribed Image Text:9.
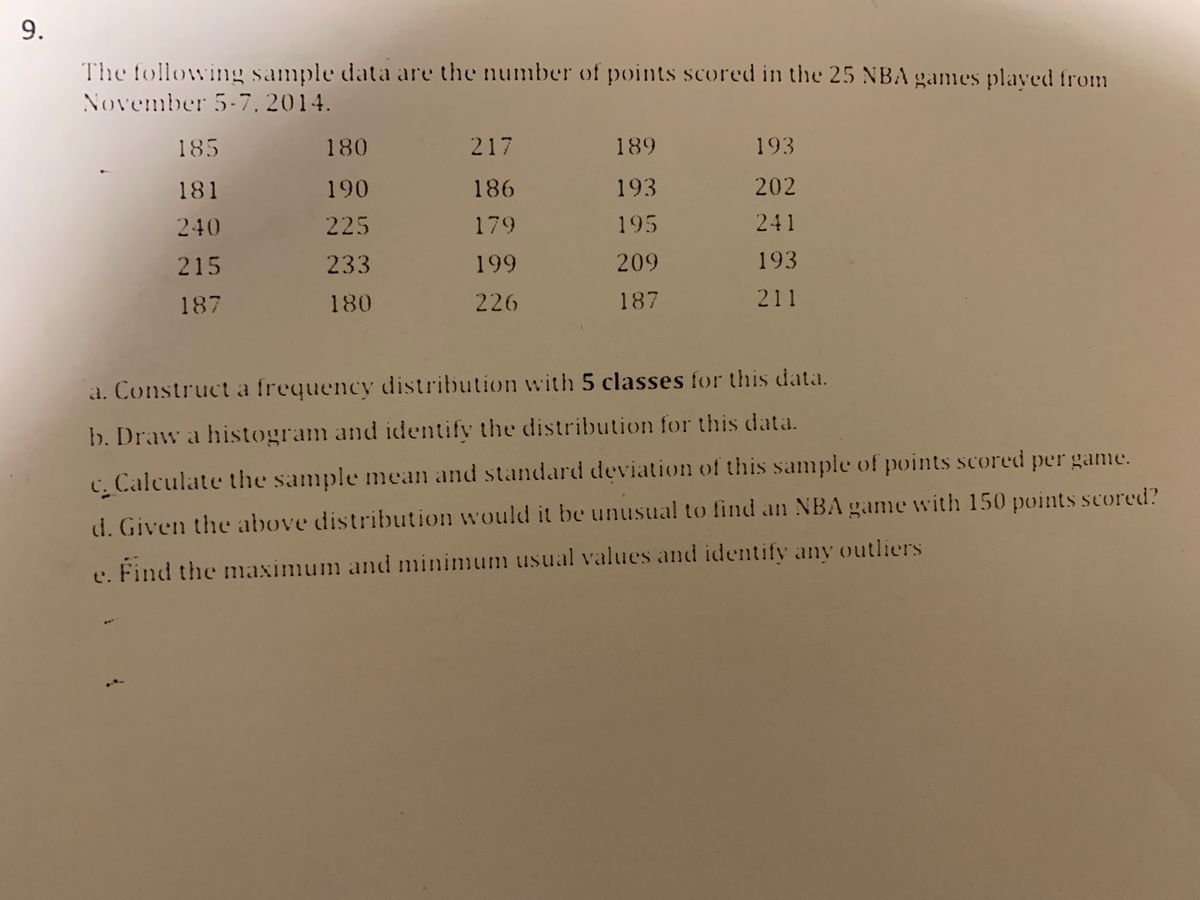
The following sample data are the number of points scored in the 25 NBA games played from
November 5-7, 2014.
185
180
217
189
193
181
190
186
193
202
240
225
179
195
241
215
233
199
209
193
187
180
226
187
211
a. Construct a frequency distribution with 5 classes for this data.
b. Draw a histogram and identify the distribution for this data.
C. Calculate the sample mean and standard deviation of this sample of points scored per game.
d. Given the above distribution would it be unusua! to find an NBA game with 150 points scored?
e. Find the maximum and minimum usual values and identify any outliers
t'.
Expert Solution
arrow_forward
Step 1
Given data represents the number of points scored in the 25 NBA games:
(a) To construct frequency distribution with 5 classes for this data:
Class
Start the class interval with minimum value 179 then add class width 13 to each of the lower limits.
Frequency is the number of times an observation occurs in a given class interval.
Frequency distribution table, is given below:
| Class Interval | Frequency |
| 179 - 192 | 10 |
| 192 - 205 | 6 |
| 205 - 218 | 4 |
| 218 - 231 | 2 |
| 231 - 244 | 3 |
| Total | 25 |
arrow_forward
Step 2
(b) Histogram can be obtained using Excel, steps to follow are given below:
- Enter the data in Excel sheet
- Select the data, go to Insert
- Under different chart groups, choose Histogram
- Add chart title and axis titles
Excel output is given below:
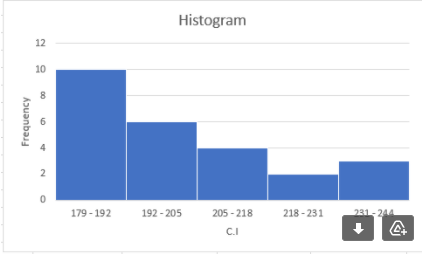
The distribution of points per game for these 25 NBA teams is skewed to the right. The spread is from 179 to 241 with no apparent outliers.

Step by stepSolved in 3 steps with 1 images

Knowledge Booster


Learn more about
Need a deep-dive on the concept behind this application? Look no further. Learn more about this topic, statistics and related others by exploring similar questions and additional content below.Similar questions
- Identify the mean, median and mode based from the data below.arrow_forwardThe top 14 speeds, in miles per hour, for Pro-Stock drag racing over the past two decades are listed below. Find the mean speed 191.3 181.1 202.2 190.1 201.4 201.4 192.2 201.2 193.2 201.2 194.5 199.2 196.0 196.2 O A. 196.1 O B. 181.1 O C. 202.2 Question Viewer O D. 195.8arrow_forwardThe numbers of regular season wins for 10 football teams in a given season are given below. Determine the range, mean, variance, and standard deviation of the population data set. 2, 10, 15, 4, 14, 10, 12, 10, 3, 9arrow_forward
- A developmental psychologist is interested in studying how long babies gaze at a photograph of a human face. To test this question, she shows a picture to a sample of six babies and records the length of their gaze in seconds. The data are as follows: 12, 17, 18, 20, 20, 29. Calculate the mean, median, mode, range, variance and standard deviation for the sample.arrow_forwardhe numbers of regular season wins for 10 football teams in a given season are given below. Determine the range, mean, variance, and standard deviation of the opulation data set. 2,7, 15, 4, 14, 6, 13, 8, 3, 10arrow_forwardThe following table summarizes the grade point averages (GPAs) of graduatestudents in a statistics class. Approximate the mean GPA of the class.arrow_forward
- Complete the following frequency chart.A frequency chart of temperatures Temperature Frequency Relative Frequency 70 - 74 75 - 79 80 - 84 85 - 89 90 - 94 From the frequency chart, calculate the mean. How does the mean from the raw data (question 7) compare to the mean from the grouped data (question 9)? Use the frequency chart to create a histogram of the daily high temperatures at Cox-Dayton International Airport for June and July 2018. Describe the distribution by shape, center, and spread. Also, state whether there are any outliers.arrow_forwardA boat capsized and sank in a lake. Based on an assumption of a mean weight of 142 lb, the boat was rated to carry 60 passengers (so the load limit was 8,520 lb). After the boat sank, the assumed mean weight for similar boats was changed from 142 lb to 171 lb. Complete parts a and b below. a. Assume that a similar boat is loaded with 60 passengers, and assume that the weights of people are normally distributed with a mean of 178.5 lb and a standard deviation of 36.9 lb. Find the probability that the boat is overloaded because the 60 passengers have a mean weight greater than 142 lb. The probability is 1.000. (Round to four decimal places as needed.) C.. b. The boat was later rated to carry only 13 passengers, and the load limit was changed to 2,223 lb. Find the probability that the boat is overloaded because the mean weight of the passengers is greater than 171 (so that their total weight is greater than the maximum capacity of 2,223 lb). The probability is. (Round to four decimal…arrow_forwardFind the mean median and mode for the score in the following frequency distribution tablearrow_forward
arrow_back_ios
arrow_forward_ios
Recommended textbooks for you
- MATLAB: An Introduction with ApplicationsStatisticsISBN:9781119256830Author:Amos GilatPublisher:John Wiley & Sons Inc
 Probability and Statistics for Engineering and th...StatisticsISBN:9781305251809Author:Jay L. DevorePublisher:Cengage Learning
 Statistics for The Behavioral Sciences (MindTap C...StatisticsISBN:9781305504912Author:Frederick J Gravetter, Larry B. WallnauPublisher:Cengage Learning
  Elementary Statistics: Picturing the World (7th E...StatisticsISBN:9780134683416Author:Ron Larson, Betsy FarberPublisher:PEARSON
 The Basic Practice of StatisticsStatisticsISBN:9781319042578Author:David S. Moore, William I. Notz, Michael A. FlignerPublisher:W. H. Freeman
 Introduction to the Practice of StatisticsStatisticsISBN:9781319013387Author:David S. Moore, George P. McCabe, Bruce A. CraigPublisher:W. H. Freeman
MATLAB: An Introduction with Applications
Statistics
ISBN:9781119256830
Author:Amos Gilat
Publisher:John Wiley & Sons Inc
Probability and Statistics for Engineering and th...
Statistics
ISBN:9781305251809
Author:Jay L. Devore
Publisher:Cengage Learning
Statistics for The Behavioral Sciences (MindTap C...
Statistics
ISBN:9781305504912
Author:Frederick J Gravetter, Larry B. Wallnau
Publisher:Cengage Learning
Elementary Statistics: Picturing the World (7th E...
Statistics
ISBN:9780134683416
Author:Ron Larson, Betsy Farber
Publisher:PEARSON
The Basic Practice of Statistics
Statistics
ISBN:9781319042578
Author:David S. Moore, William I. Notz, Michael A. Fligner
Publisher:W. H. Freeman
Introduction to the Practice of Statistics
Statistics
ISBN:9781319013387
Author:David S. Moore, George P. McCabe, Bruce A. Craig
Publisher:W. H. Freeman