
MATLAB: An Introduction with Applications
6th Edition
ISBN: 9781119256830
Author: Amos Gilat
Publisher: John Wiley & Sons Inc
expand_more
expand_more
format_list_bulleted
Related questions
Question
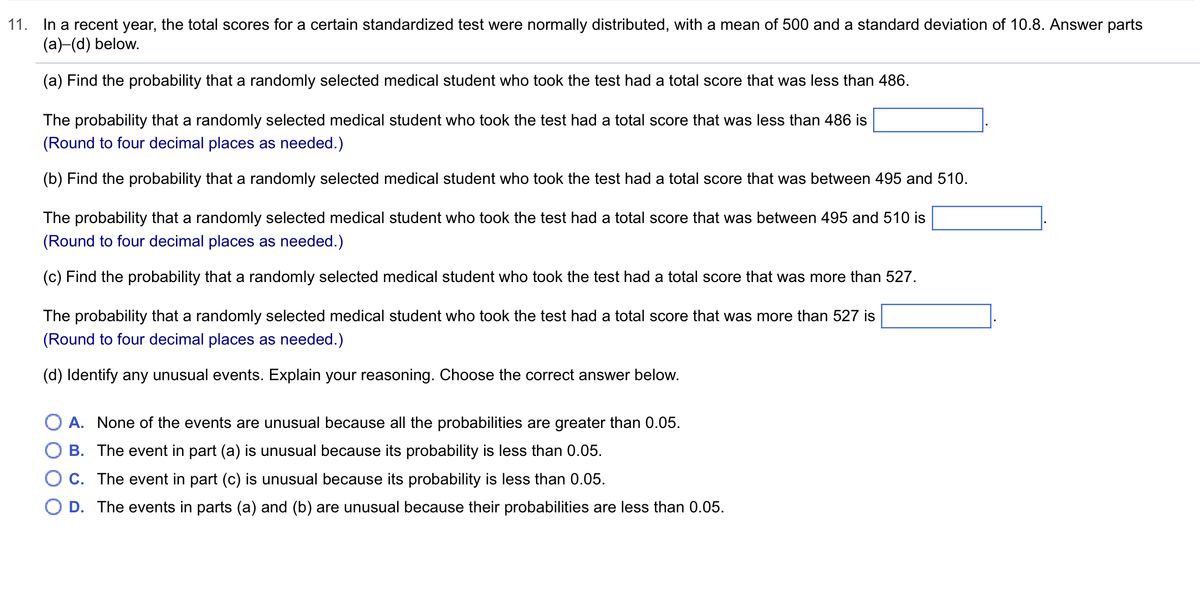

Transcribed Image Text:11. In a recent year, the total scores for a certain standardized test were normally distributed, with a mean of 500 and a standard deviation of 10.8. Answer parts
(a)-(d) below.
(a) Find the probability that a randomly selected medical student who took the test had a total score that was less than 486.
The probability that a randomly selected medical student who took the test had a total score that was less than 486 is
(Round to four decimal places as needed.)
(b) Find the probability that a randomly selected medical student who took the test had a total score that was between 495 and 510.
The probability that a randomly selected medical student who took the test had a total score that was between 495 and 510 is
(Round to four decimal places as needed.)
(c) Find the probability that a randomly selected medical student who took the test had a total score that was more than 527.
The probability that a randomly selected medical student who took the test had a total score that was more than 527 is
(Round to four decimal places as needed.)
(d) Identify any unusual events. Explain your reasoning. Choose the correct answer below.
O A. None of the events are unusual because all the probabilities are greater than 0.05.
B. The event in part (a) is unusual because its probability is less than 0.05.
OC. The event in part (c) is unusual because its probability is less than 0.05.
O D. The events in parts (a) and (b) are unusual because their probabilities are less than 0.05.
Expert Solution
This question has been solved!
Explore an expertly crafted, step-by-step solution for a thorough understanding of key concepts.

This is a popular solution

Trending nowThis is a popular solution!

Step by stepSolved in 5 steps with 4 images

Knowledge Booster

Similar questions
- The following table shows the number of people that have either 0, 1, 2 or 3 cars registered in their name, from a sample of 311 people. x n 0 93 1 91 2 60 3 67 (a) Find the mean number of cars owned for this sample. Give your answer to at least 2 decimal places. (b) Find the standard deviation of cars owned for this sample. Give your answer to at least 2 decimal places.arrow_forwardUse z scores to compare the given values. The tallest living man at one time had a height of 238 cm. The shortest living man at that time had a height of 142.4 cm. Heights of men at that time had a mean of 175.45 cm and a standard deviation of 5.59 cm. Which of these two men had the height that was more extreme? ... Since the z score for the tallest man is z = 0 and the z score for the shortest man is z = the man had the height that was Im- more extreme. (Round to two decimal places.) shortest tallestarrow_forwardA standardized exam’s score are normally distributed. In a recent year, the mean test score was 1477 and the standard was 315. The test scores of four students selected at random 1860 1230, 2160, and 1360. Find the Z- score that correspond to each value and determine wether any of the values are unusual. The Z-score for 1860 is-The Z-score for 1230 is-The Z-score for 2160 is-The Z-score for 1360is-arrow_forward
- The percent of fat calories that a person consumes each day is normally distributed with a mean of about 35 and a standard deviation of about ten. Suppose that 9 individuals are randomly chosen. Let X = average percent of fat calories. For the group of 9, find the probability that the average percent of fat calories consumed is more than six. (Round your answer to four decimal places.)arrow_forwardThe average amount of money spent for lunch per person in the college cafeteria is $5.99 and the standard deviation is $2.1. Suppose that 49 randomly selected lunch patrons are observed. Assume the distribution of money spent is normal, and round all answers to 4 decimal places where possible. For the group of 49 patrons, find the probability that the average lunch cost is between $5.77 and $6.08.arrow_forwardThe amount of time that people spend at Grover Hot Springs is normally distributed with a mean of 64 minutes and a standard deviation of 14 minutes. Suppose one person at the hot springs is randomly chosen. Let X = the amount of time that person spent at Grover Hot Springs . Round all answers to 4 decimal places where possible. a. What is the distribution of X? X - N( b. Find the probability that a randomly selected person at the hot springs stays longer then 57 minutes. c. The park service is considering offering a discount for the 7% of their patrons who spend the least time at the hot springs. What is the longest amount of time a patron can spend at the hot springs and still receive the discount? minutes. d. Find the Inter Quartile Range (IQR) for time spent at the hot springs. Q1: minutes Q3: minutes IQR: minutesarrow_forward
- n a school district, all sixth grade students take the same standardized test. The superintendant of the school district takes a random sample of 21 scores from all of the students who took the test. She sees that the mean score is 128 with a standard deviation of 41.4416. The superintendant wants to know if the standard deviation has changed this year. Previously, the population standard deviation was 25. Is there evidence that the standard deviation of test scores has increased at the α=0.005 level? Assume the population is normally distributed. Step 1 of 5 : State the null and alternative hypotheses. Round to four decimal places when necessary.arrow_forwardSuppose a batch of steel rods produced at a steel plant have a mean length of 178 millimeters, and a standard deviation of 12 millimeters. If 76 rods are sampled at random from the batch, what is the probability that the mean length of the sample rods would differ from the population mean by less than 0.56 millimeters? Round your answer to four decimal places.arrow_forwardr a standardized psychology examination intended for psychology majors, the historical data show that scores have a mean of 510 and a standard deviation of 170 . The grading process of this year's exam has just begun. The average score of the 40 exams graded so far is 526 . What is the probability that a sample of 40 exams will have a mean score of 526 or more if the exam scores follow the same distribution as in the past? Carry your intermediate computations to at least four decimal places. Round your answer to at least three decimal places.arrow_forward
arrow_back_ios
arrow_forward_ios
Recommended textbooks for you
- MATLAB: An Introduction with ApplicationsStatisticsISBN:9781119256830Author:Amos GilatPublisher:John Wiley & Sons Inc
 Probability and Statistics for Engineering and th...StatisticsISBN:9781305251809Author:Jay L. DevorePublisher:Cengage Learning
 Statistics for The Behavioral Sciences (MindTap C...StatisticsISBN:9781305504912Author:Frederick J Gravetter, Larry B. WallnauPublisher:Cengage Learning
  Elementary Statistics: Picturing the World (7th E...StatisticsISBN:9780134683416Author:Ron Larson, Betsy FarberPublisher:PEARSON
 The Basic Practice of StatisticsStatisticsISBN:9781319042578Author:David S. Moore, William I. Notz, Michael A. FlignerPublisher:W. H. Freeman
 Introduction to the Practice of StatisticsStatisticsISBN:9781319013387Author:David S. Moore, George P. McCabe, Bruce A. CraigPublisher:W. H. Freeman
MATLAB: An Introduction with Applications
Statistics
ISBN:9781119256830
Author:Amos Gilat
Publisher:John Wiley & Sons Inc
Probability and Statistics for Engineering and th...
Statistics
ISBN:9781305251809
Author:Jay L. Devore
Publisher:Cengage Learning
Statistics for The Behavioral Sciences (MindTap C...
Statistics
ISBN:9781305504912
Author:Frederick J Gravetter, Larry B. Wallnau
Publisher:Cengage Learning
Elementary Statistics: Picturing the World (7th E...
Statistics
ISBN:9780134683416
Author:Ron Larson, Betsy Farber
Publisher:PEARSON
The Basic Practice of Statistics
Statistics
ISBN:9781319042578
Author:David S. Moore, William I. Notz, Michael A. Fligner
Publisher:W. H. Freeman
Introduction to the Practice of Statistics
Statistics
ISBN:9781319013387
Author:David S. Moore, George P. McCabe, Bruce A. Craig
Publisher:W. H. Freeman