
MATLAB: An Introduction with Applications
6th Edition
ISBN: 9781119256830
Author: Amos Gilat
Publisher: John Wiley & Sons Inc
expand_more
expand_more
format_list_bulleted
Related questions
Concept explainers
Question

Transcribed Image Text:1/1
75%
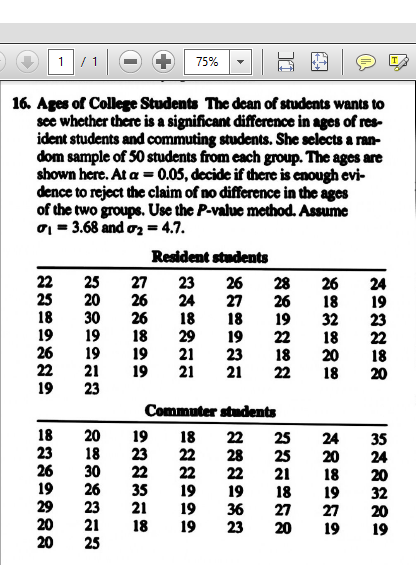
16. Ages of College Students The dean of students wants to
see whether there is a significant difference in ages of res-
ident students and commuting students. She selects a ran-
dom sample of 50 students from cach group. The ages are
shown here. At a = 0.05, decide if there is enough evi-
dence to reject the claim of no difference in the ages
of the two groups. Use the P-value method. Assume
o = 3.68 and oz = 4.7.
Resident students
27
22
25
18
19
26
22
19
25
20
30
19
19
21
23
26
26
18
19
19
23
24
18
29
21
21
26
27
18
19
23
21
28
26
19
22
18
22
26
18
32
18
20
18
24
19
23
22
18
20
Commuter students
18
23
26
19
29
20
20
20
18
30
26
23
21
25
19
23
22
35
21
18 22
28
22
19
36
23
25
25
21
18
27
20
24
20
18
19
27
19
35
24
20
32
20
19
22
22
19
19
19
18
Expert Solution
This question has been solved!
Explore an expertly crafted, step-by-step solution for a thorough understanding of key concepts.

This is a popular solution

Trending nowThis is a popular solution!

Step by stepSolved in 5 steps

Knowledge Booster


Learn more about
Need a deep-dive on the concept behind this application? Look no further. Learn more about this topic, statistics and related others by exploring similar questions and additional content below.Similar questions
- You are the operations manager for an airline and you are considering a higher fare level for passengers in aisle seats. How many randomly selected air passengers must you survey? Assume you want to be 90% confident that the sample percentage is within 2.5 percentage points of the true population percentage. Completed parts a and b below. A.) assume that nothing is known about the percentage of passengers who prefer aisle seats. N= ____ (round up to the nearest integer) B.) assume that a prior survey suggest that about 35% of air passengers prefer an aisle seat. N=____ (round up to the nearest integer)arrow_forwardA food company is planning to market a new kind of cereal; however before, they want to find the % of people who will like it. They select a random sample of 500 people and ask them to try the cereal. Of 500, 290 people say they like it. Compute the 95% cofidence interval for the % of the pop. that will like the cereal. Interept this cofidence interval.arrow_forward= 12,000 and p = 0.71. A random sample of 902 elements selected from this population gave p 0.61. Find For a population, N the sampling error. Enter the exact answer. sampling error =arrow_forward
- Using the same question from #3 A survey is done to find out the favorite movies of 500 children. The children are categorized into male and female, and a sample of 50 children is chosen. Answer the following question: If the number of female children is 300, what is the sample size of each stratum? a male sample: 40 and female sample: 10 b male sample; 25 and female sample: 25 c male sample: 30 and female sample: 20 d male sample: 20 and female sample: 30arrow_forwardYou are the operations manager for an airline and you are considering a higher fare level for passengers in aisle seats. How many randomly selected air passengers must you survey? Assume that you want to be 90% confident that the sample percentage is within 1.5 percentage points of the true population percentage. Complete parts (a) and (b) below. a. Assume that nothing is known about the percentage of passengers who prefer aisle seats. n= (Round up to the nearest integer.) nter corrarrow_forwardThere are 150 members of the senior class. You survey 25 members of the class randomly and 22 say they are going to attend the dance. How many seniors are likely to be at the dance?arrow_forward
- USE EXCEL to solve this problem. Thanks.arrow_forwardHans plays a game when he exercises. He chooses a marble from a bag of three marbles: one is blue, one is red, and one is green. Based on the marble he chooses, he completes a certain number of push-ups, as shown below. Marble Number of push-ups blue red green 10 Consider choosing a marble like sampling from a population. (The population mean of the number of push-ups is u=9.00 and the population standard deyiation is o =0.82.) (a) Suppose a sample of size 2 is randomly selected from the population, with replacement, as follows. One marble is randomly chosen, the number of push- ups is completed, and the marble is put back into the bag. Then for a second time a marble is randomly chosen and the number of push-ups is completed. There are 9 possible samples. The numbers of push-ups for several of the possible samples have been listed in the table below. Enter the numbers of push-ups for the remaining possible samples. When you are done, select "Compute". In the "Sample mean, x" column,…arrow_forward
arrow_back_ios
arrow_forward_ios
Recommended textbooks for you
- MATLAB: An Introduction with ApplicationsStatisticsISBN:9781119256830Author:Amos GilatPublisher:John Wiley & Sons Inc
 Probability and Statistics for Engineering and th...StatisticsISBN:9781305251809Author:Jay L. DevorePublisher:Cengage Learning
 Statistics for The Behavioral Sciences (MindTap C...StatisticsISBN:9781305504912Author:Frederick J Gravetter, Larry B. WallnauPublisher:Cengage Learning
  Elementary Statistics: Picturing the World (7th E...StatisticsISBN:9780134683416Author:Ron Larson, Betsy FarberPublisher:PEARSON
 The Basic Practice of StatisticsStatisticsISBN:9781319042578Author:David S. Moore, William I. Notz, Michael A. FlignerPublisher:W. H. Freeman
 Introduction to the Practice of StatisticsStatisticsISBN:9781319013387Author:David S. Moore, George P. McCabe, Bruce A. CraigPublisher:W. H. Freeman
MATLAB: An Introduction with Applications
Statistics
ISBN:9781119256830
Author:Amos Gilat
Publisher:John Wiley & Sons Inc
Probability and Statistics for Engineering and th...
Statistics
ISBN:9781305251809
Author:Jay L. Devore
Publisher:Cengage Learning
Statistics for The Behavioral Sciences (MindTap C...
Statistics
ISBN:9781305504912
Author:Frederick J Gravetter, Larry B. Wallnau
Publisher:Cengage Learning
Elementary Statistics: Picturing the World (7th E...
Statistics
ISBN:9780134683416
Author:Ron Larson, Betsy Farber
Publisher:PEARSON
The Basic Practice of Statistics
Statistics
ISBN:9781319042578
Author:David S. Moore, William I. Notz, Michael A. Fligner
Publisher:W. H. Freeman
Introduction to the Practice of Statistics
Statistics
ISBN:9781319013387
Author:David S. Moore, George P. McCabe, Bruce A. Craig
Publisher:W. H. Freeman