
ENGR.ECONOMIC ANALYSIS
14th Edition
ISBN: 9780190931919
Author: NEWNAN
Publisher: Oxford University Press
expand_more
expand_more
format_list_bulleted
Related questions
Question
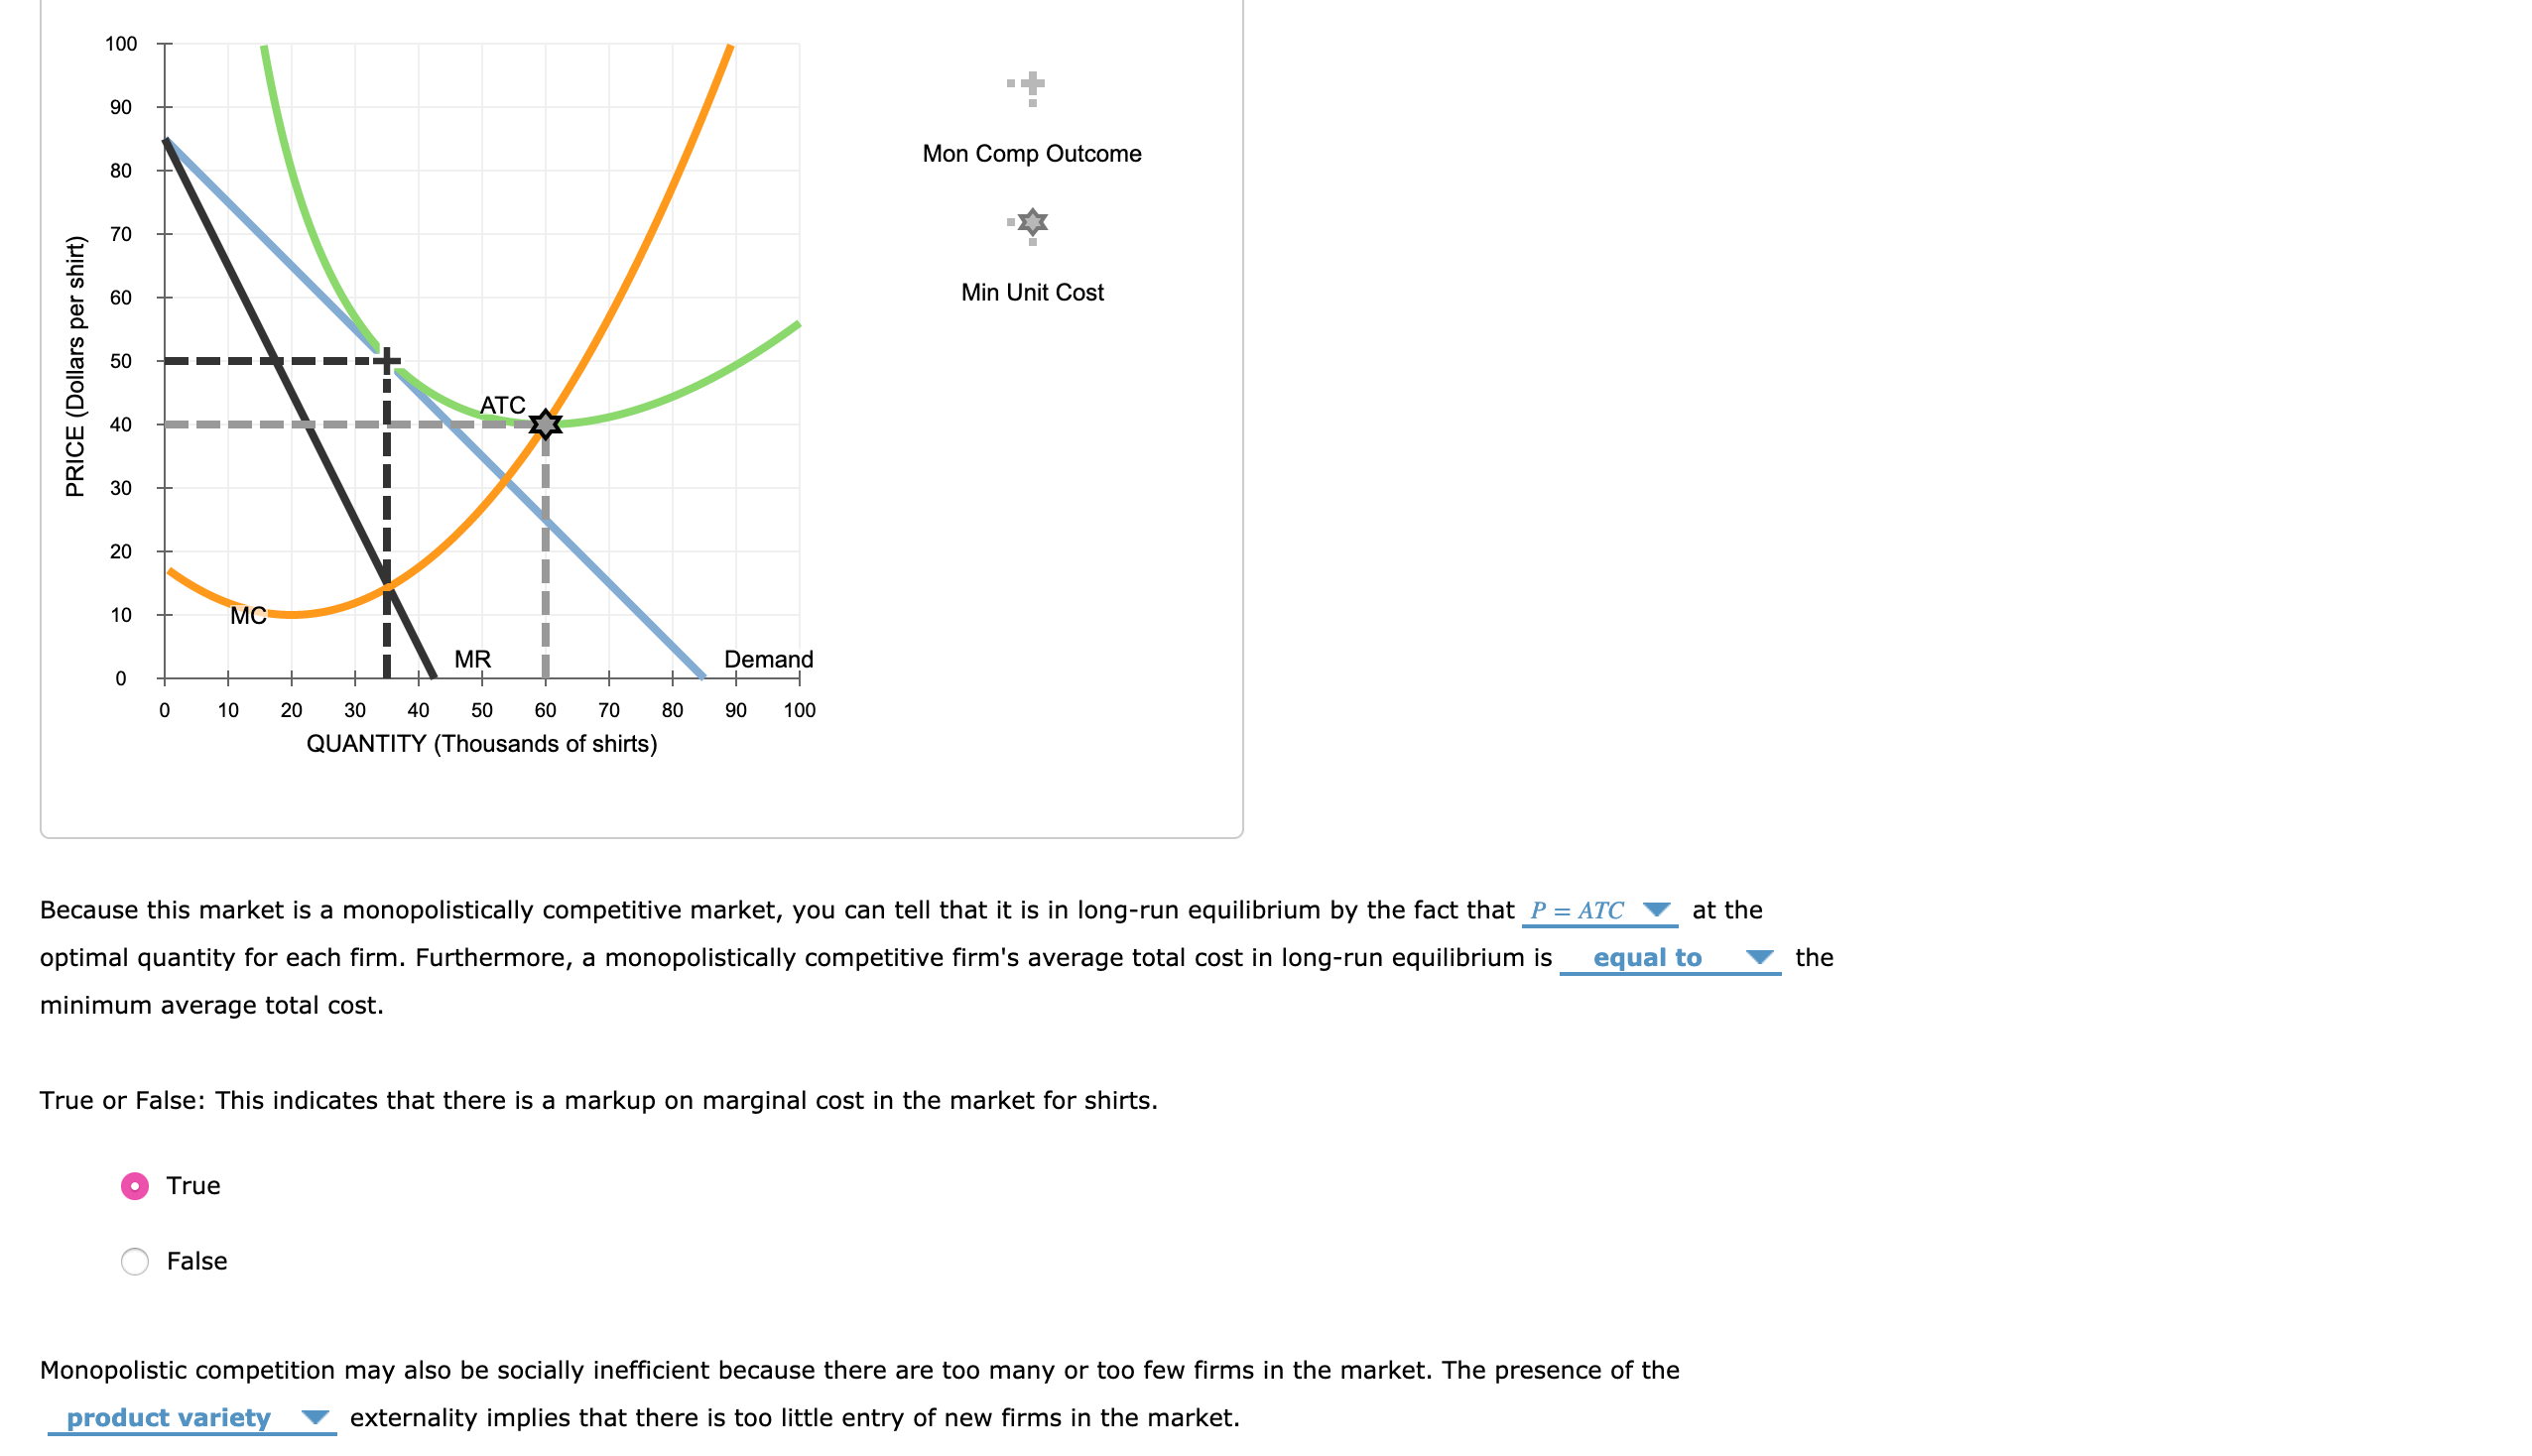
Suppose that a firm produces polo shirts in a monopolistically competitive market. The following graph shows its demand curve, marginal revenue (MR) curve, marginal cost (MC) curve, and average total cost (ATC) curve.
Place a black point (plus symbol) on the graph to indicate the long-run monopolistically competitive equilibrium price and quantity for this firm. Next, place a grey point (star symbol) to indicate the minimum average total cost the firm faces and the quantity associated with that cost.

Transcribed Image Text:100
90
Mon Comp Outcome
80
70
60
Min Unit Cost
50
ATC
40
30
20
10
MC
MR
Demand
10
20
30
40
50
60
70
80
90
100
QUANTITY (Thousands of shirts)
Because this market is a monopolistically competitive market, you can tell that it is in long-run equilibrium by the fact that P= ATC
at the
optimal quantity for each firm. Furthermore, a monopolistically competitive firm's average total cost in long-run equilibrium is
equal to
the
minimum average total cost.
True or False: This indicates that there is a markup on marginal cost in the market for shirts.
True
False
Monopolistic competition may also be socially inefficient because there are too many or too few firms in the market. The presence of the
product variety
externality implies that there is too little entry of new firms in the market.
PRICE (Dollars per shirt)
Expert Solution
This question has been solved!
Explore an expertly crafted, step-by-step solution for a thorough understanding of key concepts.

This is a popular solution

Trending nowThis is a popular solution!

Step by stepSolved in 2 steps with 1 images

Knowledge Booster


Learn more about
Need a deep-dive on the concept behind this application? Look no further. Learn more about this topic, economics and related others by exploring similar questions and additional content below.Similar questions
- BYOB is a monopolist in beer production and distribution in the imaginary economy of Hopsville. Suppose that BYOB cannot price discriminate; that is, it sells its beer at the same price per can to all customers. The following graph shows the marginal cost (MC), marginal revenue (MR), average total cost (ATC), and demand (D) for beer in this market. Place the black point (plus symbol) on the graph to indicate the profit-maximizing price and quantity for BYOB. If BYOB is making a profit, use the green rectangle (triangle symbols) to shade in the area representing its profit. On the other hand, if BYOB is suffering a loss, use the purple rectangle (diamond symbols) to shade in the area representing its loss. Suppose that BYOB charges $2.50 per can. Your friend Charles says that since BYOB is a monopoly with market power, it should charge a higher price of $3.00 per can because this will increase BYOB’s profit. Complete the following table to determine whether Charles is…arrow_forwardIn the long run, the positive economic profits earned by the monopolistic competitor will attract a response either from existing firms in the industry or firms outside. As those firms capture the original firm’s profit, what will happen to the original firm’s profit-maximizing price and output levels? Show on a grapharrow_forwardWhich type of a firm, monopolistically competitive or a monopoly, will have a greater incentive to advertise its product? Please give an explanation.arrow_forward
- What are the characteristics of monopolistically competitive markets? If the price of the product in a monopolistically competitive market increases what happens to the number of individual firms in the market and to the level of profit in the long run? Fully explain your answer.arrow_forwardSuppose the tattoo shop market in Richmond is monopolistically competitive. Consider the market from the perspective of one tattoo parlor, Roses & Thorns. Suppose there were positive economic profits in the market and an additional two tattoo parlors enter the market. What happens to the demand curve for Roses & Thorns tattoos shifts up shifts down stays the samearrow_forwardSuppose that a company operates in the monopolistically competitive market for denim jackets. The following graph shows the demand curve, marginal revenue (MR) curve, marginal cost (MC) curve, and average total cost (ATC) curve for the firm. Place a black point (plus symbol) on the graph to indicate the long-run monopolistically competitive equilibrium price and quantity for this firm. Next, place a grey point (star symbol) to indicate the minimum average total cost the firm faces and the quantity associated with that cost. ? 100 PRICE (Dollars per jacket) 8 20 60 50 X ATC 20 MC MR 2 2 2 2 10 0 0 30 40 50 60 70 QUANTITY (Thousands of jackets) 10 20 80 Demand 90 100 Mon Comp Outcome Min Unit Costarrow_forward
- Suppose that a firm produces wooden train engines in a monopolistically competitive market. The following graph shows its demand curve, marginal revenue (MR) curve, marginal cost (MC) curve, and average total cost (ATC) curve: Place a black point (plus symbol) on the graph to indicate the long-run monopolistically competitive equilibrium price and quantity for this firm, Next, place a grey point (star symbol) to indicate the minimum average total cost the firm faces and the quantity associated with that cost.arrow_forwardBYOB is a monopolist in beer production and distribution in the imaginary economy of Hopsville. Suppose that BYOB cannot price discriminate; that is, it sells its beer at the same price per can to all customers. The following graph shows the marginal cost (MC), marginal revenue (MR), average total cost (ATC), and demand (D) for beer in this market. Place the black point (plus symbol) on the graph to indicate the profit-maximizing price and quantity for BYOB. If BYOB is making a profit, use the green rectangle (triangle symbols) to shade in the area representing its profit. On the other hand, if BYOB is suffering a loss, use the purple rectangle (diamond symbols) to shade in the area representing its loss. PRICE (Dollars per can) 4.00 3.50 3.00 2.50 2.00 1.50 1.00 0.50 0 MC 0 0.5 1.5 ATC MR D 1.0 2.0 2.5 3.0 QUANTITY (Thousands of cans of beer) 3.5 4.0 Monopoly Outcome Profit Lossarrow_forwardPlace the black point (plus symbol) on the graph to indicate the short-run profit-maximizing price and quantity for this monopolistically competitive company. Then, use the green rectangle (triangle symbols) to shade the area representing the company's profit or loss. Note: Dashed drop lines will automatically extend to both axes. Select and drag the rectangles from the palette to the graph. To resize, select one of the points on the rectangle and move to the desired position. PRICE (Dollars per bike) 500 450 400 350 PRICE (Dollars per bike) 300 250 200 150 100 50 0 0 MC + 50 100 AC MR 150 200 250 300 350 400 450 500 QUANTITY (Bikes) Demand Enjano Given the profit-maximizing choice of output and price, the shop is earning shops in the industry than in long-run equilibrium. + Monopolistically Competitive Outcome Now consider the long run in which bike manufacturers are free to enter and exit the market. QUANTITY (Bikes) Show the possible effect of free entry and exit by shifting the…arrow_forward
- Suppose that a company operates in the monopolistically competitive market for denim jackets. The following graph shows the demand curve, marginal revenue (MR) curve, marginal cost (MC) curve, and average total cost (ATC) curve for the firm. Place a black point (plus symbol) on the graph to indicate the long-run monopolistically competitive equilibrium price and quantity for this firm. Next, place a grey point (star symbol) to indicate the minimum average total cost the firm faces and the quantity associated with that cost. PRICE (Dollars per jacket) 100 90 80 50 ATC 30 2 8 8 2 2 2 2 ° 60 MC MR Demand 0 + 0 10 20 30 40 50 60 70 80 90 100 QUANTITY (Thousands of jackets) Mon Comp Outcome Min Unit Cost (?)arrow_forwardMonopolistic competition creates inefficiency because of the markups and excess capacity. The graph below depicts the situation for a hypothetical monopolistically competitive firm. The curves included in the graph are demand (D), marginal revenue (MR), average total cost (ATC), and marginal cost (MC). The graph is not graded, but you can move the point labeled P to help you find the numeric values to answer the questions. Price $ 80 MC M 45 P D ATC Quantity What is the size of the markup on the price? Number $0 What is the size of the excess capacity? Number Unitsarrow_forwardSuppose you manage a firm in a monopolistically competitive market Suppose you manage a firm in a monopolistically competitive market. Which of the following strategies will do a better job of helping you maintain economic profits: obtaining a celebrity endorsement for your product or supporting the entry of firms that will compete directly with your biggest rival? Explain your answer. Suppose you manage a firm in a monopolistically competitive marketarrow_forward
arrow_back_ios
SEE MORE QUESTIONS
arrow_forward_ios
Recommended textbooks for you
 Principles of Economics (12th Edition)EconomicsISBN:9780134078779Author:Karl E. Case, Ray C. Fair, Sharon E. OsterPublisher:PEARSON
 Engineering Economy (17th Edition)EconomicsISBN:9780134870069Author:William G. Sullivan, Elin M. Wicks, C. Patrick KoellingPublisher:PEARSON
 Principles of Economics (MindTap Course List)EconomicsISBN:9781305585126Author:N. Gregory MankiwPublisher:Cengage Learning
 Managerial Economics: A Problem Solving ApproachEconomicsISBN:9781337106665Author:Luke M. Froeb, Brian T. McCann, Michael R. Ward, Mike ShorPublisher:Cengage Learning
 Managerial Economics & Business Strategy (Mcgraw-...EconomicsISBN:9781259290619Author:Michael Baye, Jeff PrincePublisher:McGraw-Hill Education
Principles of Economics (12th Edition)
Economics
ISBN:9780134078779
Author:Karl E. Case, Ray C. Fair, Sharon E. Oster
Publisher:PEARSON
Engineering Economy (17th Edition)
Economics
ISBN:9780134870069
Author:William G. Sullivan, Elin M. Wicks, C. Patrick Koelling
Publisher:PEARSON
Principles of Economics (MindTap Course List)
Economics
ISBN:9781305585126
Author:N. Gregory Mankiw
Publisher:Cengage Learning
Managerial Economics: A Problem Solving Approach
Economics
ISBN:9781337106665
Author:Luke M. Froeb, Brian T. McCann, Michael R. Ward, Mike Shor
Publisher:Cengage Learning
Managerial Economics & Business Strategy (Mcgraw-...
Economics
ISBN:9781259290619
Author:Michael Baye, Jeff Prince
Publisher:McGraw-Hill Education