
ENGR.ECONOMIC ANALYSIS
14th Edition
ISBN: 9780190931919
Author: NEWNAN
Publisher: Oxford University Press
expand_more
expand_more
format_list_bulleted
Related questions
Question

Transcribed Image Text:QUESTION 10
product Y
28
24
20
16
12
8
4
0
0
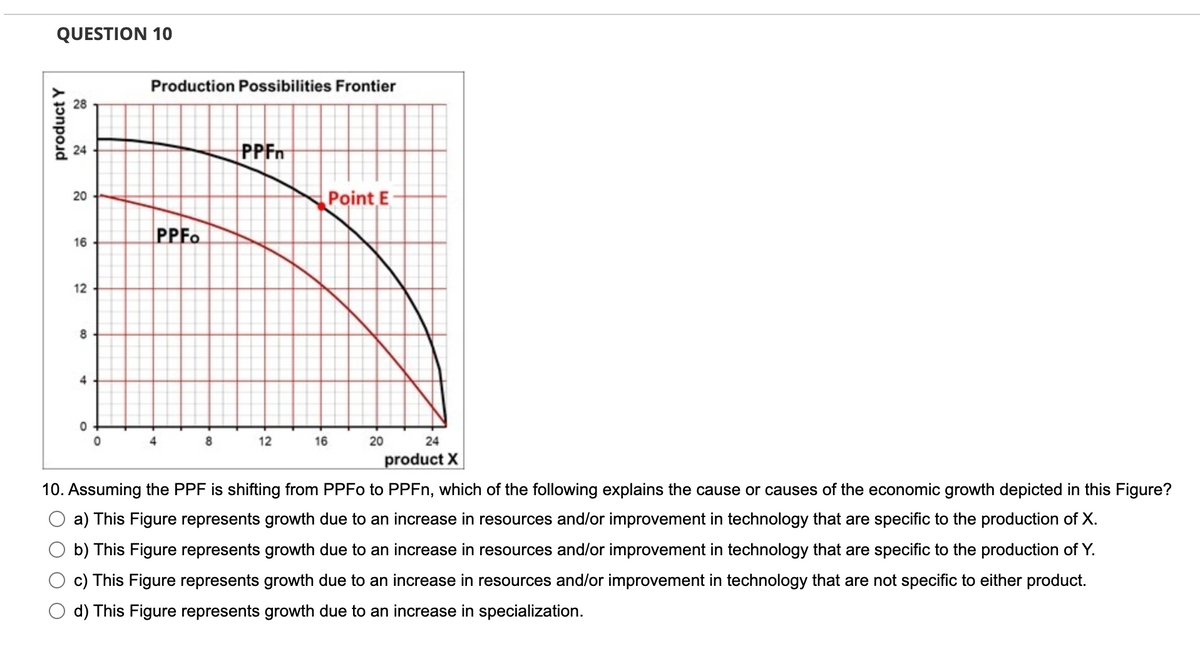
Production Possibilities Frontier
PPFO
4
8
PPFn
12
16
Point E
20
24
product X
10. Assuming the PPF is shifting from PPFO to PPFn, which of the following explains the cause or causes of the economic growth depicted in this Figure?
a) This Figure represents growth due to an increase in resources and/or improvement in technology that are specific to the production of X.
b) This Figure represents growth due to an increase in resources and/or improvement in technology that are specific to the production of Y.
This Figure represents growth due to an increase in resources and/or improvement in technology that are not specific to either product.
d) This Figure represents growth due to an increase in specialization.
Expert Solution
arrow_forward
Step 1: Define production possibility frontier (PPF):
It can be defined as the graphical representation of the combination of two products that can be produced by an individual or an economy by using the given level of inputs and technology efficiently in a particular period of time.

Step by stepSolved in 4 steps

Knowledge Booster


Learn more about
Need a deep-dive on the concept behind this application? Look no further. Learn more about this topic, economics and related others by exploring similar questions and additional content below.Similar questions
- QUESTION 11 Using the Rule of 70, a country will roughly double its GDP in thirty-five years if its annual growth rate is However, if its annual growth rate is 5%, its GDP will roughly double in O 2 percent; 14 years O 7.5 percent; 10 years O 3.5 percent; 5 years O 2.5 percent; 25 yearsarrow_forwardProduction possibilities (alternatives) A Capital goods 5 Consumer goods 0 B 5 achieve economic growth. с 3 9 D 2 12 A achieve the full employment of available resources. B allocate its available resources most efficiently among alternative uses. use its resources more efficiently than the data in the table now indicate. E 1 14 F 0 Refer to the above table. For this economy to produce a total output of 3 units of capital goods and 13 units of consumer goods it must: 15arrow_forwardSuppose that we can produce 10 units of output with 5 units of labour and 5 units of capital. Which assumption on technology implies that this would mean that we can also produce 6 units of outpu with 5 units of labour and 5 units of capital? O Convexity O Non-reversibility O Additivity O Divisibility O Free-disposabilityarrow_forward
- According to the text, European countries' growth rates of real GDP per capita Select one: O a. decreased in the first two decades after 1980 and then increased in the following two decades. O b. decreased during each of the four decades beginning 1980. O c. followed a random pattern during the four decades beginning 1980. O d. remained constant during each of the four decades beginning 1980.arrow_forward1. Economic models Consider the following production possibilities frontier model for an economy that produces only two goods: bartey and cars. 100 80 PPF 20 20 40 60 60 100 BARLEY (Miions of busheis) CARS (Miions)arrow_forwardExplainarrow_forward
- Which of the following statements about the opportunity cost of economic growth is correct? The opportunity cost of economic growth O A. is human capital O B. is capital consumption O C. is greater the faster we make our production grow O D. is zeroarrow_forward3/25/22, 10:54 PM Assignment Print View 3. The graphs below show the production possibilities frontiers for apples and peaches in Italy and Turkey. (i Italy's Production Possibilities 4.0 3.6 3.2 2.8 A 2.4 2.0 1.6 1.2 0.8 0.4 Peaches (millions of tons) https://ezto.mheducation.com/hm.tpx?todo=c15SinglePrintView&singleQuestionNo=3.&postSubmissionView=13252718360410217&wid=13252718466068729&rol... 1/3 5.2 4.8 4.4 Y4.0 3.6 3.2 2.8 2.4 2.0 1.6 0.8 0.4 Apples (millions of tons)arrow_forwardI think my answer is right. How would you read this graph?arrow_forward
- Exhibit: Sugar and Freight Trains Tons of sugar per period 244 225 180 100 23 O 19 tons of sugar. 45 tons of sugar. 80 tons of sugar. O 3 freight trains. 2 3 O 4 Quantity of freight trains per period Suppose the economy is operating at point C. The opportunity cost of producing the fourth freight train would be:arrow_forwardN6arrow_forward1..arrow_forward
arrow_back_ios
SEE MORE QUESTIONS
arrow_forward_ios
Recommended textbooks for you
 Principles of Economics (12th Edition)EconomicsISBN:9780134078779Author:Karl E. Case, Ray C. Fair, Sharon E. OsterPublisher:PEARSON
 Engineering Economy (17th Edition)EconomicsISBN:9780134870069Author:William G. Sullivan, Elin M. Wicks, C. Patrick KoellingPublisher:PEARSON
 Principles of Economics (MindTap Course List)EconomicsISBN:9781305585126Author:N. Gregory MankiwPublisher:Cengage Learning
 Managerial Economics: A Problem Solving ApproachEconomicsISBN:9781337106665Author:Luke M. Froeb, Brian T. McCann, Michael R. Ward, Mike ShorPublisher:Cengage Learning
 Managerial Economics & Business Strategy (Mcgraw-...EconomicsISBN:9781259290619Author:Michael Baye, Jeff PrincePublisher:McGraw-Hill Education
Principles of Economics (12th Edition)
Economics
ISBN:9780134078779
Author:Karl E. Case, Ray C. Fair, Sharon E. Oster
Publisher:PEARSON
Engineering Economy (17th Edition)
Economics
ISBN:9780134870069
Author:William G. Sullivan, Elin M. Wicks, C. Patrick Koelling
Publisher:PEARSON
Principles of Economics (MindTap Course List)
Economics
ISBN:9781305585126
Author:N. Gregory Mankiw
Publisher:Cengage Learning
Managerial Economics: A Problem Solving Approach
Economics
ISBN:9781337106665
Author:Luke M. Froeb, Brian T. McCann, Michael R. Ward, Mike Shor
Publisher:Cengage Learning
Managerial Economics & Business Strategy (Mcgraw-...
Economics
ISBN:9781259290619
Author:Michael Baye, Jeff Prince
Publisher:McGraw-Hill Education