
MATLAB: An Introduction with Applications
6th Edition
ISBN: 9781119256830
Author: Amos Gilat
Publisher: John Wiley & Sons Inc
expand_more
expand_more
format_list_bulleted
Related questions
Question
1.Please give the equation representing each of however many subgroups are implied by the regression results in the small model.
2.Please substantively interpret the coefficients of the two independent variables in the small model.
Please explain
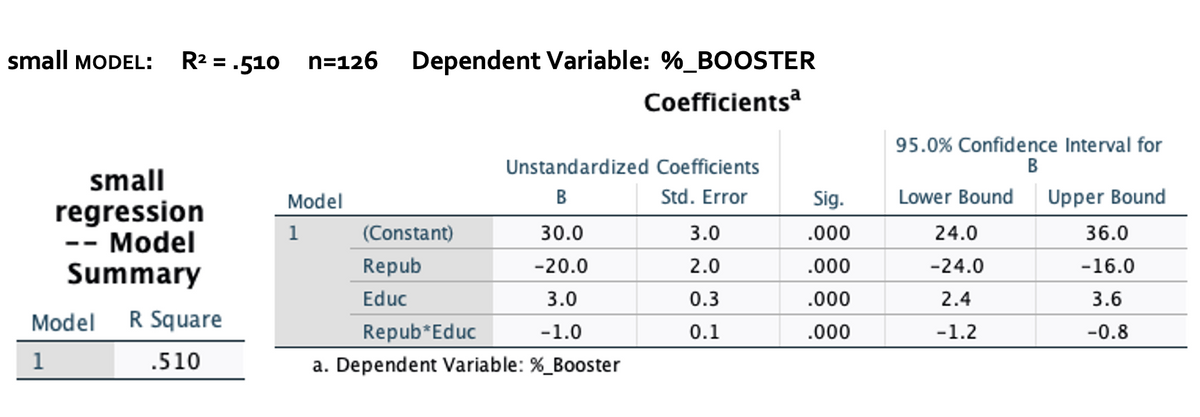

Transcribed Image Text:small MODEL:
small
regression
-- Model
Summary
R² = .510 n=126 Dependent Variable: %_BOOSTER
Coefficientsa
Unstandardized Coefficients
Model
B
Std. Error
1
(Constant)
30.0
3.0
Repub
-20.0
2.0
Educ
3.0
0.3
Repub*Educ
-1.0
0.1
a. Dependent Variable: %_Booster
Model
1
R Square
.510
Sig.
.000
.000
.000
.000
95.0% Confidence Interval for
B
Lower Bound Upper Bound
24.0
36.0
-24.0
-16.0
2.4
3.6
-1.2
-0.8

Transcribed Image Text:DEPENDENT VARIABLE -- %_BOOSTER: = Percent of adults in county who received a COVID-19 booster
shot;
REPUB: =1 if a majority of registered voters in county are Republicans, o otherwise;
EDUC: = mean number of years of education of adults age 25 and above;
REPUB*EDUC: = interaction (product) of REPUB and EDUC;
SOUTH: = 1 if county is in the southern part of the U.S., o otherwise;
URBAN: = 1 if county is primarily urban, o otherwise
Expert Solution
This question has been solved!
Explore an expertly crafted, step-by-step solution for a thorough understanding of key concepts.

Step by stepSolved in 2 steps with 2 images

Knowledge Booster

Similar questions
- Can a causal relationship be established between a variable y and a variable x by running the following regressions: i) y = f(x) and ii) x = f(y). Explain in less than 75 words.arrow_forwardThe Wall Street Journal asked Concur Technologies, Inc., an expense management company, to examine data from million expense reports to provide insights regarding business travel expenses. Their analysis of the data showed that New York was the most expensive city. The following table shows the average daily hotel room rate () and the average amount spent on entertainment () for a random sample of of the most-visited U.S. cities. These data lead to the estimated regression equation . For these data . Click on the datafile logo to reference the data. Use Table 1 of Appendix B. full question attached in ss thanks for help aprpeicated aigjrowoirjarrow_forwardThe quadratic regression equation shown below is for a sample of n=22. a. Predict Y for X1=3. (Type an integer or a decimal.)arrow_forward
- In Step 2: Construct an estimated simple linear regression model how did you come up with the column X*X ?arrow_forwardThis data table contians the listed prices and weights of the diamonds in 48 rings offered for sale in The Singapore Times. The prices are in Singapore dollars, with the weights in crats. Estimate the linear regression using weight as the explanatory variable and price as the response variable using the following two methods: a) Create a scatterplot with trendline (be sure to show the equation and R-square on the chart.) b) Use the Data Analysis Toolpak to do the work for you.arrow_forward
arrow_back_ios
arrow_forward_ios
Recommended textbooks for you
- MATLAB: An Introduction with ApplicationsStatisticsISBN:9781119256830Author:Amos GilatPublisher:John Wiley & Sons Inc
 Probability and Statistics for Engineering and th...StatisticsISBN:9781305251809Author:Jay L. DevorePublisher:Cengage Learning
 Statistics for The Behavioral Sciences (MindTap C...StatisticsISBN:9781305504912Author:Frederick J Gravetter, Larry B. WallnauPublisher:Cengage Learning
  Elementary Statistics: Picturing the World (7th E...StatisticsISBN:9780134683416Author:Ron Larson, Betsy FarberPublisher:PEARSON
 The Basic Practice of StatisticsStatisticsISBN:9781319042578Author:David S. Moore, William I. Notz, Michael A. FlignerPublisher:W. H. Freeman
 Introduction to the Practice of StatisticsStatisticsISBN:9781319013387Author:David S. Moore, George P. McCabe, Bruce A. CraigPublisher:W. H. Freeman
MATLAB: An Introduction with Applications
Statistics
ISBN:9781119256830
Author:Amos Gilat
Publisher:John Wiley & Sons Inc
Probability and Statistics for Engineering and th...
Statistics
ISBN:9781305251809
Author:Jay L. Devore
Publisher:Cengage Learning
Statistics for The Behavioral Sciences (MindTap C...
Statistics
ISBN:9781305504912
Author:Frederick J Gravetter, Larry B. Wallnau
Publisher:Cengage Learning
Elementary Statistics: Picturing the World (7th E...
Statistics
ISBN:9780134683416
Author:Ron Larson, Betsy Farber
Publisher:PEARSON
The Basic Practice of Statistics
Statistics
ISBN:9781319042578
Author:David S. Moore, William I. Notz, Michael A. Fligner
Publisher:W. H. Freeman
Introduction to the Practice of Statistics
Statistics
ISBN:9781319013387
Author:David S. Moore, George P. McCabe, Bruce A. Craig
Publisher:W. H. Freeman