
MATLAB: An Introduction with Applications
6th Edition
ISBN: 9781119256830
Author: Amos Gilat
Publisher: John Wiley & Sons Inc
expand_more
expand_more
format_list_bulleted
Related questions
Question
1.Calculate the
2.Generate a graph to describe the distribution of height and insert it below.
Would you think that the assumption that height was normal is accurate? Why or why not?
Are speed and height associated? Why or why not?
Generate a graph or table that supports.
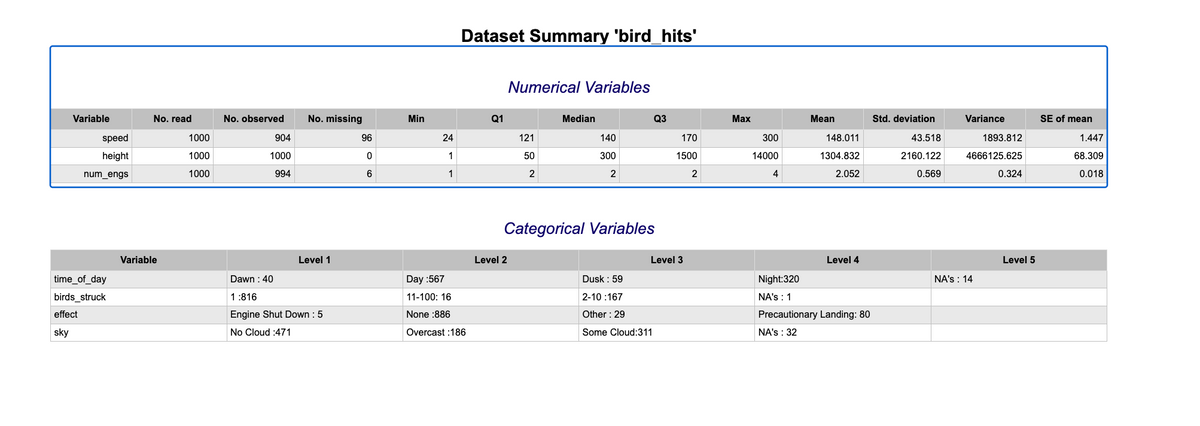

Transcribed Image Text:Variable
speed
height
num_engs
time_of_day
birds_struck
effect
sky
No. read
Variable
1000
1000
1000
No. observed
904
1000
994
No. missing
Level 1
Dawn : 40
1:816
Engine Shut Down : 5
No Cloud :471
96
0
6
Min
24
1
1
Dataset Summary 'bird_hits'
Day :567
11-100: 16
None :886
Overcast :186
Q1
Numerical Variables
Level 2
121
50
2
Median
140
300
2
Categorical Variables
Q3
Dusk : 59
2-10 :167
Other : 29
Some Cloud:311
170
1500
2
Level 3
Max
300
14000
4
Mean
148.011
1304.832
2.052
Level 4
Night:320
NA's : 1
Precautionary Landing: 80
NA's : 32
Std. deviation
43.518
2160.122
0.569
Variance
1893.812
4666125.625
NA's : 14
0.324
Level 5
SE of mean
1.447
68.309
0.018
Expert Solution
This question has been solved!
Explore an expertly crafted, step-by-step solution for a thorough understanding of key concepts.

Step by stepSolved in 3 steps with 3 images

Knowledge Booster

Similar questions
- should have the right to marry. (The 2014 data were collected before the 2015 U.S. C2. GSS 2014 and GSS 2018 respondents were asked their opinion on whether homosexuals 30 measured on a 5-point scale from strongly agree (1) to strongly disagree (5). Supreme Court decision granting same-sex couples the right to marry. Responses wer measured on a 5-point scale from strongly agree (1) to strong!y aisagiee (2). Cumulative Percentage Homosexuals Should Have Right to Marry (2014) Percentage Frequency 32.5 32.5 Strongly agree 251 57.5 25.2 Agree 195 67.3 Neither agree nor disagree 9.6 74 79.2 Disagree 92 11.9 100.0 Strongly disagree 161 20.8 Total 773 100.0 Homosexuals Should Have Cumulative Right to Marry (2018) Frequency Percentage Percentage Strongly agree 293 39.5 39.5 Agree 200 27.0 66.5 Neither agree nor disagree 70 9.4 75.9 Disagree 67 9.0 84.9 Strongly disagree 111 15.0 99.9 Total 741 99.9 a. What is the level of measurement for this variable? b. What is the mode for 2014? For 2018?arrow_forwardIf the students read only 101 books for the month of June, which measure of central tendency will have the greatest change? A. The median will have the greatest change. B. The mean will have the greatest change. C. All measures will have an equal change. D. The mode will have the greatest change.arrow_forwardSuppose there are 5 students in a room. The mean age is 20.0 years, and the median age is 19. If the youngest person leaves and is not replaced by another person, what happens to the mean and the median? The mean either increases or stays the same, and the median increases. The median either increases or stays the same, and the mean increases. The mean increases, but it is impossible to determine whether the median increases, decreases, or stays the same.arrow_forward
- This histogram shows the heights of 20 students in a statistics class. Explain why it is not appropriate to find summary statistics for this distribution. Frequency 4- 3- 2- 1- T 0+ 60 65 70 75 Height (Inches) Choose the correct answer below. OA. Since there appear to be two modes, this data probably represents men and women and should be split into those two groups before finding any summary statistics. OB. The number of data values is too small for summary statistics to be meaningful. OC. Since the data appear to be bimodal, no other measures of center or spread can be calculated. OD. Since the distribution is not symmetric, summary statistics would be meaningless.arrow_forwardI NEED HELP 1. Consider a distribution of 10 scores: 2, 5, 8, 1, 9, 3, 0, 3, 9, and a mystery score that is greater than 5. Is itpossible to determine the Median of the distribution? If yes, what is the median? Explain how you know the answerarrow_forwardthe table below shows the number of books the Jefferson Middle school students readeach month for nine months. Month Sept. Oct. Nov. Dec. Jan. Feb. Mar. Apr. May Number of Books 293 280 266 280 289 279 275 296 271 If the students read only 101 books for the month of June, which measure of central tendency will have the greatest change?A. The mean will have the greatest change.B. The median will have the greatest change.C. All measures will have an equal change.D. The mode will have the greatest change.arrow_forward
- Think of your own example of a data set that would follow a normal distribution and explain why.arrow_forwardBelow is a box plot showing the ages of actors and actresses. Ages of Oscar Winning Actors from 1975 to 2004 Female E Male 20 40 60 80 100 Age Which has a higher median? data is needed to tell both have the same median actors O actressesarrow_forwardThe first picture is the question and the second is the ones that I need help with. Thanks!arrow_forward
- The side-by-side dotplot below displays the arm spans, Which statement is NOT true? in centimeters, for two classes. The mean arm span appears to be similar for the two Arm Span (cm) Class A Class B classes. 8. 3 1 9 65 42 1 14 3 The arm spans for Class A have less variability than the arm spans for Class B. 5 6 0 22233 5 67 0 3 The arm spans for Class B have more variability than the arm spans for Class A. 16 99 5 16 The arm spans for Class A are roughly symmetric, while those for Class B are skewed left. 1 0 17 9965 17 320 18 0 12 6 6 18 6. 36 19 20 Key: 15|5 = 155 cm LO5 CO (ON7 O CO O Carrow_forwardq3arrow_forwardThe data below are the frequency of cremation burials found in 17 archaeological sites. a. Obtain the mean, median, and mode of these data. b. Which measure of center do you think works best here? 83 69 44 49 516 34 33 281 2340 44 371 27 89 430 58 242 122 a. The mean isarrow_forward
arrow_back_ios
SEE MORE QUESTIONS
arrow_forward_ios
Recommended textbooks for you
- MATLAB: An Introduction with ApplicationsStatisticsISBN:9781119256830Author:Amos GilatPublisher:John Wiley & Sons Inc
 Probability and Statistics for Engineering and th...StatisticsISBN:9781305251809Author:Jay L. DevorePublisher:Cengage Learning
 Statistics for The Behavioral Sciences (MindTap C...StatisticsISBN:9781305504912Author:Frederick J Gravetter, Larry B. WallnauPublisher:Cengage Learning
  Elementary Statistics: Picturing the World (7th E...StatisticsISBN:9780134683416Author:Ron Larson, Betsy FarberPublisher:PEARSON
 The Basic Practice of StatisticsStatisticsISBN:9781319042578Author:David S. Moore, William I. Notz, Michael A. FlignerPublisher:W. H. Freeman
 Introduction to the Practice of StatisticsStatisticsISBN:9781319013387Author:David S. Moore, George P. McCabe, Bruce A. CraigPublisher:W. H. Freeman
MATLAB: An Introduction with Applications
Statistics
ISBN:9781119256830
Author:Amos Gilat
Publisher:John Wiley & Sons Inc
Probability and Statistics for Engineering and th...
Statistics
ISBN:9781305251809
Author:Jay L. Devore
Publisher:Cengage Learning
Statistics for The Behavioral Sciences (MindTap C...
Statistics
ISBN:9781305504912
Author:Frederick J Gravetter, Larry B. Wallnau
Publisher:Cengage Learning
Elementary Statistics: Picturing the World (7th E...
Statistics
ISBN:9780134683416
Author:Ron Larson, Betsy Farber
Publisher:PEARSON
The Basic Practice of Statistics
Statistics
ISBN:9781319042578
Author:David S. Moore, William I. Notz, Michael A. Fligner
Publisher:W. H. Freeman
Introduction to the Practice of Statistics
Statistics
ISBN:9781319013387
Author:David S. Moore, George P. McCabe, Bruce A. Craig
Publisher:W. H. Freeman