1.42 4.11 4.22 12.28 9.16 28.62 7.92 24.82 9.59 29.82 Find estimates for the linear model yi N(0,0²). Bo+Bixi +Ei where ei ~ That is find Bo, B1, 6. Also perform a test of the null hypothesis Ho B₁ = 0 at level a = 0.01. 1
Q: A furniture and home decor store owner would like to explore the relationship between family size…
A: We have given a furniture and home decor store owner would like to explore the relationship between…
Q: A company that sells musical instruments has been in business for five years. During that time,…
A: Year Quarter 1 Quarter 2 Quarter 3 Quarter 4 Total Yearly sales 1 5 2 1 5 13 2 7 4 4 14 29 3…
Q: Given P(A) = 0.6 and P(A and B) = 0.2 and P(B) = 0.6, then P(A|B) = 0.3 0.3333333... 0.4…
A: Answer: Given that, P(A) = 0.6 P(B) = 0.6 P(A and B) = 0.2
Q: Below is a chart that shows the previous 4 periods of pancake sales for Steve's diner. Period 1 2 3…
A: The data for the previous 4 periods of pancake sales is given.
Q: A researcher is interested in examining whether self-affirming oneself leads to increases in…
A: The spread of the data set was obtained by subtracting the maximum and minimum values. It is also…
Q: 7. Randomized block design A company would like to choose among three leading Internet service…
A: The response variable is the download speed in Mbps, the factor of interest is the ISP chosen for…
Q: the potential credit is incorrect
A:
Q: Suppose that (Y, X) satisfy the assumptions specified here. A random sample of n = 455 is drawn and…
A: The specified regression line is: Y^=6.38+5.84X 2.9 2.2 From the above, the standard…
Q: The following is the scores of an exam: 40 50 50 52 58 58 62 65 68 72 79 80 80 87 90 96 98 Calculate…
A: Data X: 40,50,50,52,58,58,62,65,68,72,79,80,80,87,90,96,98
Q: The null hypothesis will be rejected at x=0.05 if the test statistic exceeds: (a) 12.59
A: From the given output, The number of rows is 2. The number of columns is 3. α=0.05
Q: Use the normal distribution of SAT critical reading scores for which the mean is 501 and the…
A: Given that SAT critical scores are normally distributed. Mean (μ) = 501 Standard deviation (σ) =…
Q: State the hypotheses and identify the claim. :H0= ▼ then claim or not claim :H1= ▼ then claim or…
A: Sample size n =27 Sample mean=22.2 Population standard deviation =3.7 NOTE:- According to bartleby…
Q: The weights of ice cream cartons are normally distributed with a mean weight of 8 ounces and a…
A: (a) The probability that a randomly selected carton has a weight greater than 8.09 ounces is…
Q: We have the following probability table for the random variable X. For what value of a, E[X] = 16.5?…
A: Answer: From the given data, X : 10 a 20 25 P(X=x) :…
Q: The shape of the distribution of the time required to get an oil change at a 15-minute oil-change…
A: a) Consider a random variable x defines the time required to get an oil change.
Q: Pick one or more and look at the image below A) estimated beta (slope) for this relationship is…
A: The scatterplot is a graphical representation which shows the relationship b/w 2 variables.
Q: Use a table of areas to find each of the shaded areas under the Standard Normal Distribution. (a)…
A: Solution-: Let, Z- be the standard normal random variable (a) P(0<Z<1.96)=? (b)…
Q: This is exactly what I got but the answer in the system says it is incorrect.
A: The sample size is 64, sample mean is 44500 and the sample standard deviation is 6800.
Q: It is recommended to use a t-test to perform a hypothesis test for more than two groups. True False
A: A t-test is typically used to compare the means of two groups. When there are more than two groups,…
Q: If the probability of choosing a red chip from a bucket is 0.32. What is the probability of not…
A: Answer: From the given data, The probability of choosing a red chip from a bucket is 0.32 P(Red) =…
Q: Two different simple random samples are drawn from two with 1412 of them having the same common…
A: The data is given as- Size of first sample : n1=30 Proportion of common attribute in first sample:…
Q: You intend to estimate a population mean f with the following sample. 62.4 69.2 48.6 50.7 60.3 61…
A: 62.4 , 69.2, 48.6 , 50.7, 60.3, 61sample size(n)=6degrees of freedom(df)=n-1df=6-1=5
Q: If the p-value for a slope coefficient from a multiple regression model is 0.001, is this…
A: P value=0.001
Q: Which best represents an interpretation of a two sample confidence interval? We are 95% confident…
A: We have given a confidence interval for two-sample. CI = -17.5 to 20.2 We have to determine the best…
Q: The likelihood that a light bulb is defective is 6%, on a particular production line. Eight light…
A: Answer: From the given data, Let X: Defective light bulb P(Defective) = P = 6% = 0.06 Sample size…
Q: Given P(A) = 0.6 and P(A and B) = 0.2 and P(B) = 0.6, then P(A/B) = 0.3 0.3333333... 0.4…
A: Given P(A)=0.6, P(B)=0.6, P(A and B)=0.2
Q: An epidemiologist is worried about the prevalence of the flu in East Vancouver and the potential…
A:
Q: a. What are the null and alternative hypotheses? a. What are the null and alternative hypotheses?…
A: Hypothesis is an assumption that is being tested.
Q: A and B are independent events P(A) = 0.25 and P(A and B) = 0.14 then, find P(B) ?
A: Answer: Given that, A and B are independent events P(A) = 0.25 P(A and B) = 0.14
Q: Suppose that at a college, 55% of the students earn a degree at the end of four years and 27% earn a…
A: It is given that, at a college 55% of the students earn a degree at the end of four years.
Q: 2. Two independent random samples from their respective populations of interest are selected. Assume…
A: The confidence interval is the range where the population parameter is likely to occur. We can…
Q: Compute (estimate) SE. Round your answer to four decimal places. Note, you can use the summary…
A: DMD: Sample size n1=7 Sample mean x¯1=11.391 Sample standard deviation s1=2.3215 Healthy: Sample…
Q: Find the z-score that has 20.9% of the distribution's area to its left. The z-score is (Round to two…
A: Use TI-83 plus Calculator to obtain the value of Z-score The value of the Z-score is obtained…
Q: For the following hypothesis test: HO: m ≤ 14 HA: m >14 a: 0.01 with n = 38, o = 9, and x = 16,…
A: Based on the information provided, we can perform a one-sample z-test to test the given hypothesis…
Q: Mr. Guo selects a random sample of size 21 from a population that is normally distributed. The…
A: Sample mean=82 sample variance=25 standard deviation =25=5 Note:“Since you have posted a…
Q: If X is a random variable with expectation µ and variance cµ2 , where c is a constant. Find a…
A: X= random variable expectation µ and variance cμ2 where c is constant then we need to find the…
Q: A researcher records age in years (x) and systolic blood pressure (y) for volunteers. They perform a…
A: The regression equation is y^=4.5+14.4x. To test whether a linear relationship exists between x and…
Q: A study was conducted to determine the proportion of people who dream in black and white instead of…
A: People over the age of 50 are taken as group 1. n1=297 x1=55 People under the age of 25 are taken as…
Q: using operations of complementation, union and intersection of sets and also show the event…
A: Consider two events A and B. The events, represented through the Venn diagram as follows:
Q: Treat the dataset as your bag of peanut M&M’s (a simple random sample). Count the number of orange…
A: x=13n=65p^=0.2
Q: A project group last semester gathered 108 GVSU students and they found out the average time those…
A: Sample size=n=108, Degrees of freedom=df=n-1=108-1=107
Q: (a) What percent of these men run a mile between 7.11 minutes and 8 minutes? (b) What percent of…
A: Let X be the random variable that times for the mile run of college students. Given that, X~N(μ=7.11…
Q: Determine the number of ways in which 10 identical pink socks and 20 identical red socks can be…
A: We need to arrange the 20 identical red socks such that there are at least 2 red socks between any 2…
Q: In Sacramento, California 70% of the households have unlisted numbers. For a random sample of 200…
A: n=200p=0.7q=1-0.7=0.3
Q: Price in Dollars 23 26 Number of Bids 10 12 14 32 35 41 15 19 Answer How to enter your answer (opens…
A: We have given that, X :- 23, 26, 32, 35, 41 Y:- 10, 12, 14, 15, 19 Then, r = ?
Q: Use the Shapiro-Wilk test to check the normality assumption for the variable Rct. According to this…
A: The Shapiro-Wilk test is a statistical test used to determine whether a dataset is normally…
Q: 15,26,48,9,30 Select one: O a. 181.84 O b. 13.48 O c. 224.3 O d. 15.08
A: Sample data: 15, 26, 48, 9, 30. Variance is a measure of dispersion that indicates how data values…
Q: Which statement is the most accurate based on the data shown in the scatter plot?
A: Here given, Scatter plot of The number of animals that attempt to feed from the rosebus versus the…
Q: Q3: An random experiment consists of marking a point randomly inside a half-circle with a radius of…
A: Since the location of N is uniform inside the half-circle, the joint probability density function of…
Q: (b) Find the mathematical formula for the Prior distribution, using the information above and below…
A: (b) The mathematical formula for the prior distribution is: prior = Beta(p | α, β) where p is the…
![X
1.42
4.22
9.16
7.92
9.59
y
4.11
12.28
28.62
24.82
29.82
Yi
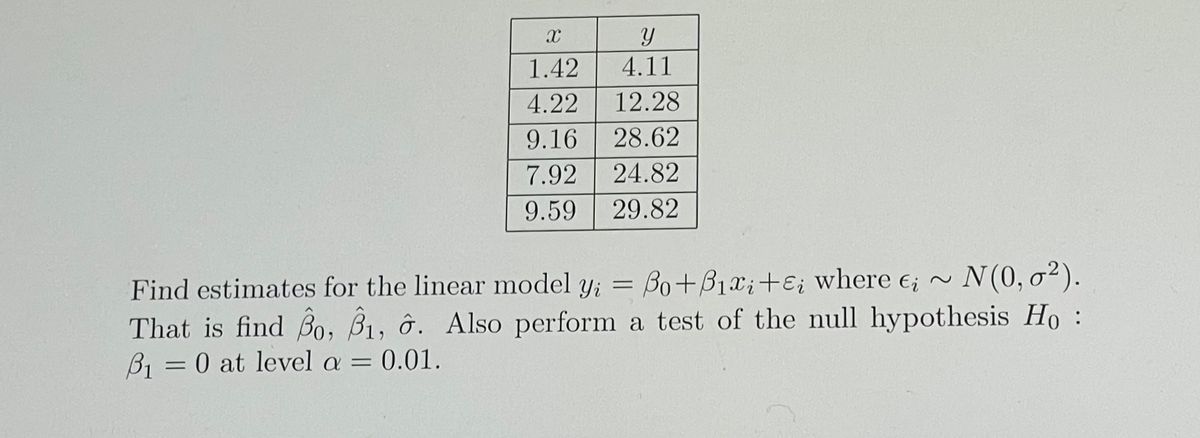
Find estimates for the linear model y; = Bo+Bixi+e; where €; ~ N(0,0²).
That is find Bo, 61, 6. Also perform a test of the null hypothesis Ho
B₁ = 0 at level a = = 0.01.](/v2/_next/image?url=https%3A%2F%2Fcontent.bartleby.com%2Fqna-images%2Fquestion%2F167bc351-5861-4d28-8f34-1fe6f02a81fc%2Ff037d550-72cc-4bb9-be82-6c6683579029%2Fgke8zs_processed.jpeg&w=3840&q=75)
![](/static/compass_v2/shared-icons/check-mark.png)
Step by step
Solved in 3 steps with 1 images
![Blurred answer](/static/compass_v2/solution-images/blurred-answer.jpg)
- The following table provides values of the function f(x,y). However, because of potential; errors in measurement, the functional values may be slightly inaccurately. Using the statistical package included with a graphical calculator or spreadsheet and critical thinking skills, find the function f(x,y)=a+bx+cy that best estimate the table where a, b and c are integers. Hint: Do a linear regression on each column with the value of y fixed and then use these four regression equations to determine the coefficient c. x y 0 1 2 3 0 4.02 7.04 9.98 13.00 1 6.01 9.06 11.98 14.96 2 7.99 10.95 14.02 17.09 3 9.99 13.01 16.01 19.022) Use Data Linearization technique to perform a fit in the form of y = (x^B)-¹ using the given data. x y 0.5 1.333 0.9 0.4115 0.333 1.5 0.231Heights (om) and weights (kg) are measured for 100 randomly selected adult males, and range from heights of 138 to 188 cm and weights of 41 to 150 kg. Let the predictor variable x be the first variable given. The 100 paired measurements yield x 167.74 cm, y 81.46 ko, r0.239, Pvalue 0.017, and y - 106 + 1,15x. Find the best predicted value of y (weight) given an adult male who is 153 cm tall. Use a 0.01 significance level. The best predicted value of y for an adult male who is 153 cm tall is kg. (Round to two decimal places as needed.)
- 2. Find the normal equations to the curve 2* = ax + bx + c %3D 2 = ax+ bx + cHeights (cm) and weights (kg) are measured for 100 randomly selected adult males, and range from heights of 132 to 194 cm and weights of 38 to 150 kg. Let the predictor variable x be the first variable given. The 100 paired measurements yield x 167.75 cm, y=81.58 kg, r0.318, P.value = 0.001, and y-109 1.14x. Find the best predicted value of y (weight) given an adult male who is 184 cm tal, Use a 0.05 significance level. The best predicted value of y for an adult male who is 184 cm tall is kg. (Round to two decimal places as needed.)Heights (cm) and weights (kg) are measured for 100 randomly selected adult males, and range from heights of 130 to 192 cm and weights of 38 to 150 kg. Let the predictor variable x be the first variable given. The 100 paired measurements yield x 167.67 cm. y=81.53 kg. r=0.356, P-value=0.000, and y= -106 +1.14x. Find the best predicted value ofy (weight) given an adult male who is 177 cm tall. Use a 0.05 significance level. The best predicted value of y for an adult male who is 177 cm tall is kg. (Round to two decimal places as needed.)
- 3. Fit a least squares quadratic curve to the following data and estimate Y at X = 2.4 fig. 03 2 3. 4. గోలిగౌజి రర్ Y 1.7 1.8 2.3 2.3 A. The required least squares quadratic curve(parabola) and the estimated value of Y at X=2.4? * 大 O Y= 2- 0.5X + 0.2X^2; Y = 1.952 Y= 2-0.6X+ 0.2X^2; Y = 1.712 O Y= 2.1 - 0.5X + 0.2X^2;Y = 2.052 Y= 2- 0.5X + 0.4X^2; Y = 3.104A statistics student is asked to estimate Y = Bo + B1X + E. She calculates the following values: Ex = 280, Σ(x₁ - x)² = 350, Σy, = 600, Σ(y, − y) = 1000 Σ(x,x)(y₁ - y) = -630, n = 20 Which of the following is the sample regression equation? OY--55.2-1.8X + e OY 55.2 +1.8X + e OY-55.2+1.8X + e OY 55.2 1.8X + eA) A linear regression has a =6 and b=5 what is y predicted as when x=9? B) A linear regression has b=3 and a=4.What is the predicted Y for x=7?
- Suppose that n = 50, i.i.d observations for (Y₁, X₁) yield the following regressions results: Ỹ= 49.2 + 73.9 X, SER = 13.4, R²=0.78 (23.5) (16.4) Another researcher is interested in the same regression, but makes an error when entering the data into a regression program: The research enters each observation twice, ending up with 100 observations (with observation 1 entered twice, observation 2 entered twice and so forth). Using these 100 observations, what results will be produced by the regression program? Complete the spaces in the equation below. Report the intercept and slope to one decimal place, but report the R2 to two decimal places. Ŷ = + * X, R² =6. Suppose we estimate a linear regression equation Y; = Bo + B1X; + u; by OLS. (a) Show thatE ûi 0, where the û;'s are the regression residuals. i3D1 (b) Suppose we regress X; on û; by OLS, including a constant term in the regression. Show that the estimated coefficient on û; is equal to zero. (c) Suppose we regress Y; on the predicted value Y; by OLS, including a constant term in the regression. Show that the estimated coefficient on Y; is equal to one. (Hint: the regression residual is defined by û; = Y; – Y; where the predicted value Y; = Bo + B,X;. Here, Bo and B1 are the OLS estimators.)4. Find the parameters and equation of the least squares regression line using the points (1,0), (3,3), and (5,6). 1 A = (XTX)-'xTY = where X = 1 3 and Y = 3 5. 11 answer 3 3 y = --+-x
![Calculus For The Life Sciences](https://www.bartleby.com/isbn_cover_images/9780321964038/9780321964038_smallCoverImage.gif)