MATLAB: An Introduction with Applications
6th Edition
ISBN: 9781119256830
Author: Amos Gilat
Publisher: John Wiley & Sons Inc
expand_more
expand_more
format_list_bulleted
Question

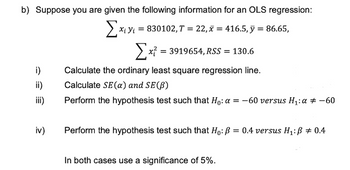
Transcribed Image Text:b) Suppose you are given the following information for an OLS regression:
Σχι
X; Y = 830102,T = 22,x=416.5, y = 86.65,
x = 3919654, RSS = 130.6
i)
Calculate the ordinary least square regression line.
Calculate SE (a) and SE (B)
Perform the hypothesis test such that Ho: a = -60 versus H₁: α = -60
Perform the hypothesis test such that Ho: P = 0.4 versus H₁: B = 0.4
In both cases use a significance of 5%.
ii)
iii)
iv)
Expert Solution
This question has been solved!
Explore an expertly crafted, step-by-step solution for a thorough understanding of key concepts.
Step by stepSolved in 4 steps with 1 images

Follow-up Questions
Read through expert solutions to related follow-up questions below.
Follow-up Question
i need iv and first three parts are solved

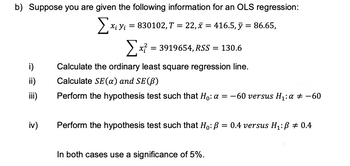
Transcribed Image Text:b) Suppose you are given the following information for an OLS regression:
Exis
Σ
Xi Yi = 830102, T = 22, x = 416.5, y = 86.65,
[x² = 3919654, RSS = 130.6
i)
Calculate the ordinary least square regression line.
ii)
Calculate SE (a) and SE (B)
iii)
Perform the hypothesis test such that Ho: a = -60 versus H₁: a = -60
iv)
Perform the hypothesis test such that Ho: B = 0.4 versus H₁: B = 0.4
In both cases use a significance of 5%.
Solution
by Bartleby Expert
Follow-up Questions
Read through expert solutions to related follow-up questions below.
Follow-up Question
i need iv and first three parts are solved

Transcribed Image Text:b) Suppose you are given the following information for an OLS regression:
Exis
Σ
Xi Yi = 830102, T = 22, x = 416.5, y = 86.65,
[x² = 3919654, RSS = 130.6
i)
Calculate the ordinary least square regression line.
ii)
Calculate SE (a) and SE (B)
iii)
Perform the hypothesis test such that Ho: a = -60 versus H₁: a = -60
iv)
Perform the hypothesis test such that Ho: B = 0.4 versus H₁: B = 0.4
In both cases use a significance of 5%.
Solution
by Bartleby Expert
Knowledge Booster
Similar questions
- Compute the coefficients b₁ and b₂ for the regression model y₁ = 60+ b₁x₁₁ +b2×21 given the summary statistics shown below. a. Tx₁y b. rx₁y c. Tx₁y d. = 0.80, x2y=0.60, =200, Sx2 = 0.40, Sx₁ 0,5x1x2 =-0.80, гx2y=0.60, rx₁x2 = -0.40, Sx₁ = 200, Sx2 = 100, sy = 500 = 100, 0, Sy = 500 100, Sy = 500 =0.80, x2y = -0.20, 0, rx₁x2 = -0.10, Sx₁ =200, Sx2 = 100, Sy = 500 =0.50, rx2y=0.75, x₁x2 = 0.70, Sx₁ =200, Sx2 =arrow_forwardAnkitarrow_forwardConsider a simple linear regression model, Y₁ = Bo + B₁X₁ + ₁ for i=1,2,...,n with the usual random error term (&) assumptions. Suppose that hypotheses Ho: P₁ = 0 against H₁:₁ <0 were tested and Ho: B₁ = 0 was rejected. Assume ₁e₁² = 0. ei i) Briefly explain what the conclusion of the test means for the values of Y given the values of X. -1 ii) Draw an example of a scatter plot with the fitted regression line for the problem mentioned above. iii) Calculate and interpret the correlation coefficient for the problem at hand.arrow_forward
- please answer correctly:arrow_forwardThe Consumer Reports Restaurant Customer Satisfaction Survey is based upon 148,599 visits to full-service restaurant chains.t Assume the following data are representative of the results reported. The variable type indicates whether the restaurant is an Italian restaurant or a seafood/steakhouse. Price indicates the average amount paid per person for dinner and drinks, minus the tip. Score reflects diners' overall satisfaction, with higher values indicating greater overall satisfaction. A score of 80 can be interpreted as very satisfied. (Let x, represent average meal price, x, represent type of restaurant, and y represent overall customer satisfaction.) Restaurant Туре Price ($) Score Bertucci's Italian 16 77 Black Angus Steakhouse Seafood/Steakhouse 24 79 Bonefish Grill Seafood/Steakhouse 26 85 Bravo! Cucina Italiana Italian 18 84 Buca di Beppo Italian 17 81 Bugaboo Creek Steak House Seafood/Steakhouse 18 77 Carrabba's Italian Grill Italian 23 86 Charlie Brown's Steakhouse…arrow_forwardSuppose that you run a regression of Y, on X, with 110 observations and obtain an estimate for the slope. Your estimate for the standard error of ₁ is 1. You are considering two different hypothesis tests: The first is a one-sided test: Ho: B1-0, Ha: 31>0, a = .05 The second is a two-sided test: Ho: 31-0, Ha: B1 0,a = .05 (a) What values of , would lead you to reject the null hypothesis in the one-sided test? (b) What values of , would lead you to reject the null hypothesis in the one-sided test? (c) What values of would lead you to reject the mill hypothesis in the one-sided test, but not the two-sided test? (d) What values of 3 would lead you to reject the null hypothesis in the two-sided test, but not the one-sided test?arrow_forward
- In a regression analysis involving 25 observations, the following estimated regression equation was developed.ŷ = 10 – 18x1 + 3x2 + 14x3Also, the following standard errors and the sum of squares were obtained.Sb1 = 3 Sb1 = 6 Sb1 = 7SST = 4,800 SSE = 1,296If we are interested in testing for the significance of the relationship among the variables (i.e., significance of the model), the critical value of F at α = .05 is _____.arrow_forwardThe authors of the paper "Predicting Yolk Height, Yolk Width, Albumen Length, Eggshell Weight, Egg Shape Index, Eggshell Thickness, Egg Surface Area of Japanese Quails Using Various Egg Traits as Regressors"t used a multiple regression model with two independent variables where y = quail egg weight (g), X, = egg width (mm), and X2 = egg length (mm). The regression function suggested in the paper is -21.658 + 0.828x, 0.373x2. + (a) What is the mean egg weight for quail eggs that have a width of 20 mm and a length of 48 mm? (Enter your answer to three decimal places.) (b) Interpret the value of B,. O When width is fixed, the mean increase in weight associated with a 1-mm increase in length is 0.373 g. When length is fixed, the mean increase in weight associated with a 1-mm increase in width is 0.373 g. O When length is fixed, the mean increase in weight associated with a 1-mm increase in width is 0.828 g. O When width is fixed, the mean increase in weight associated with a 1-mm increase…arrow_forwardThe estimated regression equation for a model involving two independent variables and 10 observations follows. ý = 22.1370 + 0.5303Xq + 0.4920X2 (a) Interpret b₁ in this estimated regression equation. O b₁ = 0.5303 is an estimate of the change in y corresponding to a 1 unit change in x₂ when x₁ is held constant. O b₁ = 0.5303 is an estimate of the change in y corresponding to a 1 unit change in x₁ when X₂ is held constant. O b₁ = 22.1370 is an estimate of the change in y corresponding to a 1 unit change in x₁ when x₂ is held constant. O b₁ = 0.4920 is an estimate of the change in y corresponding to a 1 unit change in x₂ when x₁ is held constant. O b₂ = 0.4920 is an estimate of the change in y corresponding to a 1 unit change in x₁ when x₂ is held constant. Interpret b₂ in this estimated regression equation. O b₂ = 0.4920 is an estimate of the change in y corresponding to a 1 unit change in x₂ when x₁ is held constant. O b₂ = 22.1370 is an estimate of the change in y corresponding to a…arrow_forward
arrow_back_ios
arrow_forward_ios
Recommended textbooks for you
 MATLAB: An Introduction with ApplicationsStatisticsISBN:9781119256830Author:Amos GilatPublisher:John Wiley & Sons Inc
 Probability and Statistics for Engineering and th...StatisticsISBN:9781305251809Author:Jay L. DevorePublisher:Cengage Learning
 Statistics for The Behavioral Sciences (MindTap C...StatisticsISBN:9781305504912Author:Frederick J Gravetter, Larry B. WallnauPublisher:Cengage Learning
 Elementary Statistics: Picturing the World (7th E...StatisticsISBN:9780134683416Author:Ron Larson, Betsy FarberPublisher:PEARSON
 The Basic Practice of StatisticsStatisticsISBN:9781319042578Author:David S. Moore, William I. Notz, Michael A. FlignerPublisher:W. H. Freeman
 Introduction to the Practice of StatisticsStatisticsISBN:9781319013387Author:David S. Moore, George P. McCabe, Bruce A. CraigPublisher:W. H. Freeman

MATLAB: An Introduction with Applications
Statistics
ISBN:9781119256830
Author:Amos Gilat
Publisher:John Wiley & Sons Inc

Probability and Statistics for Engineering and th...
Statistics
ISBN:9781305251809
Author:Jay L. Devore
Publisher:Cengage Learning

Statistics for The Behavioral Sciences (MindTap C...
Statistics
ISBN:9781305504912
Author:Frederick J Gravetter, Larry B. Wallnau
Publisher:Cengage Learning

Elementary Statistics: Picturing the World (7th E...
Statistics
ISBN:9780134683416
Author:Ron Larson, Betsy Farber
Publisher:PEARSON

The Basic Practice of Statistics
Statistics
ISBN:9781319042578
Author:David S. Moore, William I. Notz, Michael A. Fligner
Publisher:W. H. Freeman

Introduction to the Practice of Statistics
Statistics
ISBN:9781319013387
Author:David S. Moore, George P. McCabe, Bruce A. Craig
Publisher:W. H. Freeman