
MATLAB: An Introduction with Applications
6th Edition
ISBN: 9781119256830
Author: Amos Gilat
Publisher: John Wiley & Sons Inc
expand_more
expand_more
format_list_bulleted
Related questions
Question
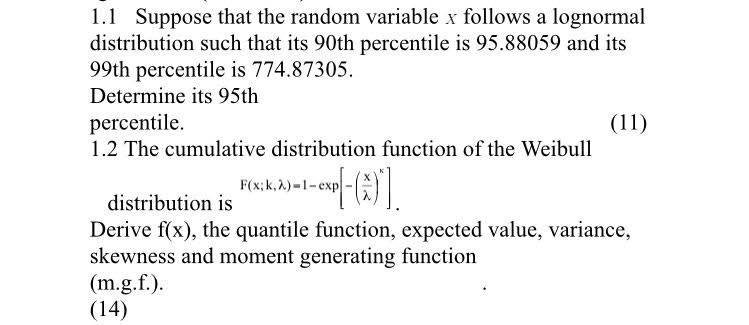

Transcribed Image Text:1.1 Suppose that the random variable x follows a lognormal
distribution such that its 90th percentile is 95.88059 and its
99th percentile is 774.87305.
Determine its 95th
percentile.
1.2 The cumulative distribution function of the Weibull
distribution is
F(x;k,λ)-1-exp
(11)
Derive f(x), the quantile function, expected value, variance,
skewness and moment generating function
(m.g.f.).
(14)
Expert Solution
This question has been solved!
Explore an expertly crafted, step-by-step solution for a thorough understanding of key concepts.

Step by stepSolved in 2 steps with 7 images

Knowledge Booster

Similar questions
- Let Y, represent the ith normal population with unknown mean #, and unknown variance of for i=1,2. Consider independent random samples, Ya, Ya, Yin, of size n,, from the ith population with sample mean Y, and sample variance S² = (₁-P) ². (d) Define V₁, a function of S1, that has a chi-square distribution. (e) Is V₁ a pivotal function to find a confidence interval for o?? Explain with argument. (f) Find a (1-a) x 100% confidence interval for ofarrow_forwardA random variable X takes value 1 with probability and the value 2 with the remaining probability. What is the variance of X, Var[X]? O 1/3 3/4 2/3 1/2 O 1/4arrow_forwardThe geometric distribution gives the probability that the first success occurs at the xth trial with success probability p. f(x)=(1-p)x-1p, x=1,2,3,... Show that E(X)=1/parrow_forward
- USA Today reported that about 20% of all people In the United States are Illiterate. Suppose you take eleven people at random off a city street. P USE SALT (a) Make a histogram showing the probability distribution of the number of illiterate people out of the eleven people in the sample. 0.30 0.30 0.25 0.25 0.20 0.20 0.15 0.15 0.10 0.10 0.05 0.05 2 3 4 5 7. 8 9 10 11 0 1 2 3 4 5 6 78 9 10 11 0.30 0.30 0.25 0.25 0.20 0.20 0.15 0.15 0.10 0.10 0.05 0.05 0. 0 1 2 3 4 5 6 7 8 9 10 11 0 1 2 3 45 6 7 8 9 10 11 (b) Find the mean and standard deviation of this probability distribution. (Round your standard deviation to two decimal places.) people people Find the expected number of people in this sample who are illiterate. peoplearrow_forwardThe random variable X takes value O with probability, and value 1 with the remaining probability. The random variable Y takes value 100 with probability and value 101 with the remaining probability. What is the relation between the variance of X and the variance of Y? Var[X] Var[Y] "arrow_forwardA,b,c,d.arrow_forward
- Let X be a normal random variable with mean 85 and a variance of 25 (i.e., X ∼ N (85, 25)). step1: Let M = aX + b for some constants a, b not equal to 0. Write an expression for the pdf of M . step 2: Suppose that X represents an approximate distribution of the final scores in a certain math course (ignore the fact that this approximation can technically have scores that are greater than 100 or less than 0). If the teacher were to curve the scores, it means he would determine a function to apply to the scores to achieve a desired distribution (assume an affine function in this case, as in the previous part). Suppose he wants the scores to be normally distributed with mean 80 and a standard deviation of 4. What should he choose for a and b? What students would see their score lowered, and what students would see their score increased?arrow_forward3 The median value y of a continuous random variable is that value such that F(y) = 0.5. Find the median value of the random variable in 90.5 = f(y) = 2 25 -Y, 0 ≤ y ≤ 5, elsewhere. 0,arrow_forwardSuppose X, Y, and Z are three independent normal random variables. X has an expected value of -7 and a standard deviation of 1.6; Y has an expected value of -9 and a standard deviation of 1.8; Z has an expected value of 8 and a standard deviation of 1.4 Let T = 2X + 4Y+7Z Variable Mean(Expected Value) Standard Deviation Coefficient X Y -7 -9 1.8 4 1.6 2 Z 8 1.4 7arrow_forward
- Consider the distribution of a discrete variable Y whose cumulative distribution function is given by 0, y < 12 12 ≤ y < 32 32 ≤ y ≤ 48 1, 48 ≤ y Enter below the variance of this distribution. F(y) 0.151, 0.699,arrow_forwardA stock price is currently $40. It is known that at the end of 1 year it will be either $48or $32. The risk-free Interest rate is 5% per annum with continuous compounding. What is the value of a portfolio today with a strike price of $527 (use A-0.25) Hint: draw a treearrow_forward
arrow_back_ios
arrow_forward_ios
Recommended textbooks for you
- MATLAB: An Introduction with ApplicationsStatisticsISBN:9781119256830Author:Amos GilatPublisher:John Wiley & Sons Inc
 Probability and Statistics for Engineering and th...StatisticsISBN:9781305251809Author:Jay L. DevorePublisher:Cengage Learning
 Statistics for The Behavioral Sciences (MindTap C...StatisticsISBN:9781305504912Author:Frederick J Gravetter, Larry B. WallnauPublisher:Cengage Learning
  Elementary Statistics: Picturing the World (7th E...StatisticsISBN:9780134683416Author:Ron Larson, Betsy FarberPublisher:PEARSON
 The Basic Practice of StatisticsStatisticsISBN:9781319042578Author:David S. Moore, William I. Notz, Michael A. FlignerPublisher:W. H. Freeman
 Introduction to the Practice of StatisticsStatisticsISBN:9781319013387Author:David S. Moore, George P. McCabe, Bruce A. CraigPublisher:W. H. Freeman
MATLAB: An Introduction with Applications
Statistics
ISBN:9781119256830
Author:Amos Gilat
Publisher:John Wiley & Sons Inc
Probability and Statistics for Engineering and th...
Statistics
ISBN:9781305251809
Author:Jay L. Devore
Publisher:Cengage Learning
Statistics for The Behavioral Sciences (MindTap C...
Statistics
ISBN:9781305504912
Author:Frederick J Gravetter, Larry B. Wallnau
Publisher:Cengage Learning
Elementary Statistics: Picturing the World (7th E...
Statistics
ISBN:9780134683416
Author:Ron Larson, Betsy Farber
Publisher:PEARSON
The Basic Practice of Statistics
Statistics
ISBN:9781319042578
Author:David S. Moore, William I. Notz, Michael A. Fligner
Publisher:W. H. Freeman
Introduction to the Practice of Statistics
Statistics
ISBN:9781319013387
Author:David S. Moore, George P. McCabe, Bruce A. Craig
Publisher:W. H. Freeman