
MATLAB: An Introduction with Applications
6th Edition
ISBN: 9781119256830
Author: Amos Gilat
Publisher: John Wiley & Sons Inc
expand_more
expand_more
format_list_bulleted
Related questions
Question

Transcribed Image Text:1.
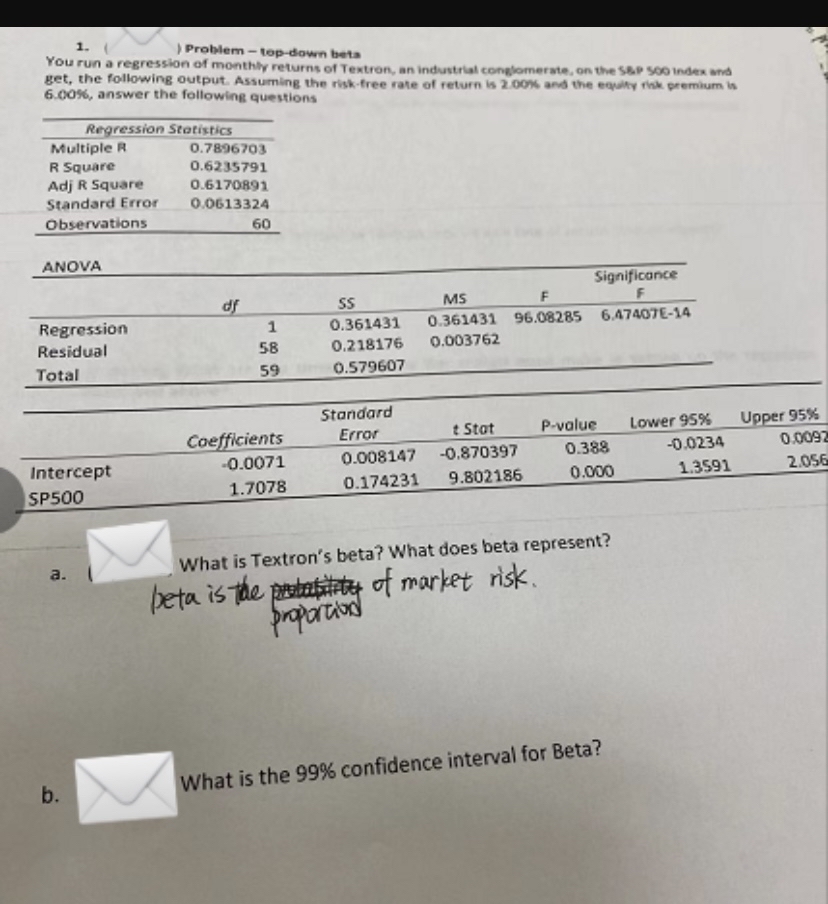
Problem -top-down beta
You run a regression of monthly returns of Textron, an industrial conglomerate, on the S&P s00 Index and
get, the following output. Assuming the risk-free rate of return is 2.00% and the equity risk premium is
6.00%, answer the following questions
Regression Statistics
Multiple R
R Square
Adj R Square
Standard Error
0.7896703
0.6235791
0.6170891
0.0613324
Observations
60
ANOVA
Significance
df
SS
MS
Regression
Residual
0.361431 96.08285 6.47407E-14
0.003762
1
0.361431
58
0.218176
Total
59
0.579607
Standard
Upper 95%
0.0092
Error
t Stat
P-value
Lower 95%
Coefficients
-0.0071
0.008147
-0.870397
0.388
-0.0234
Intercept
0.000
1.3591
2.056
1.7078
0.174231
9.802186
SP500
What is Textron's beta? What does beta represent?
a.
beta is The prstatitity of market risk.
proporcad
b.
What is the 99% confidence interval for Beta?
Expert Solution
This question has been solved!
Explore an expertly crafted, step-by-step solution for a thorough understanding of key concepts.

Step by stepSolved in 2 steps with 1 images

Knowledge Booster

Similar questions
- 1. Sue is conducting a regression analysis to predict the amount of salaries expense using the number of employees and the average rate of pay. This type of regression analysis is called a(n) independent regression. linear regression. multiple regression. dependent regression.arrow_forwardIf the R-squared for a regression model relating the outcome y to an explanatory variable x is 0.9. This implies that there is a positive linear relationship between y and x. True or false?arrow_forward9. A wildlife researcher is interested in predicting a mammal’s lifespan (in years) based on its average number of hours of sleep per night. Data was obtained from a large random sample of mammals, and the regression equation turned out as follows: Predicted lifespan = 36.93 – 1.64 (average hours of sleep) Which one of the following statements is a correct interpretation of this equation? 1. Approximately 1.64% of the variability in lifespan can be explained by the regression equation. 2. As lifespan increases by one year, average hours of sleep is predicted to decrease by 1.64 hours. 3. As lifespan increases by one year, average hours of sleep is predicted to increase by 36.93 hours. 4. As average hours of sleep increases by one hour, lifespan is predicted to increase by 36.93 years. 5. As average hours of sleep increases by one hour, lifespan is predicted to decrease by 1.64 years.arrow_forward
- You are analyzing a dataset containing 379 datapoints, and want to use 13 predictor variables to create a multiple variable linear regression model of the data. You conduct an ANOVA analysis, and yield a R² of 38%. Using this information, what would be the F statistic of your analysis?arrow_forwardThe beta of a stock has been estimated as 1.4 using regression analysis on a sample of historical returns. A commonly-used adjustment technique would provide an adjusted beta of A. 1.32. B. 1.13. C. 1.0. D. 1.27.arrow_forwardA researcher is interested in examining the relationship between spousal abuse and child abuse. Specifically, they are interested in determining whether there is a predictive relationship between spousal abuse and child abuse in 5 county social services offices. Calculate the linear regression line for the following data. Note you have already calculated the first step to this analysis (Pearson's Correlation)arrow_forward
arrow_back_ios
arrow_forward_ios
Recommended textbooks for you
- MATLAB: An Introduction with ApplicationsStatisticsISBN:9781119256830Author:Amos GilatPublisher:John Wiley & Sons Inc
 Probability and Statistics for Engineering and th...StatisticsISBN:9781305251809Author:Jay L. DevorePublisher:Cengage Learning
 Statistics for The Behavioral Sciences (MindTap C...StatisticsISBN:9781305504912Author:Frederick J Gravetter, Larry B. WallnauPublisher:Cengage Learning
  Elementary Statistics: Picturing the World (7th E...StatisticsISBN:9780134683416Author:Ron Larson, Betsy FarberPublisher:PEARSON
 The Basic Practice of StatisticsStatisticsISBN:9781319042578Author:David S. Moore, William I. Notz, Michael A. FlignerPublisher:W. H. Freeman
 Introduction to the Practice of StatisticsStatisticsISBN:9781319013387Author:David S. Moore, George P. McCabe, Bruce A. CraigPublisher:W. H. Freeman
MATLAB: An Introduction with Applications
Statistics
ISBN:9781119256830
Author:Amos Gilat
Publisher:John Wiley & Sons Inc
Probability and Statistics for Engineering and th...
Statistics
ISBN:9781305251809
Author:Jay L. Devore
Publisher:Cengage Learning
Statistics for The Behavioral Sciences (MindTap C...
Statistics
ISBN:9781305504912
Author:Frederick J Gravetter, Larry B. Wallnau
Publisher:Cengage Learning
Elementary Statistics: Picturing the World (7th E...
Statistics
ISBN:9780134683416
Author:Ron Larson, Betsy Farber
Publisher:PEARSON
The Basic Practice of Statistics
Statistics
ISBN:9781319042578
Author:David S. Moore, William I. Notz, Michael A. Fligner
Publisher:W. H. Freeman
Introduction to the Practice of Statistics
Statistics
ISBN:9781319013387
Author:David S. Moore, George P. McCabe, Bruce A. Craig
Publisher:W. H. Freeman