
MATLAB: An Introduction with Applications
6th Edition
ISBN: 9781119256830
Author: Amos Gilat
Publisher: John Wiley & Sons Inc
expand_more
expand_more
format_list_bulleted
Related questions
Question

Transcribed Image Text:Apple App Store.
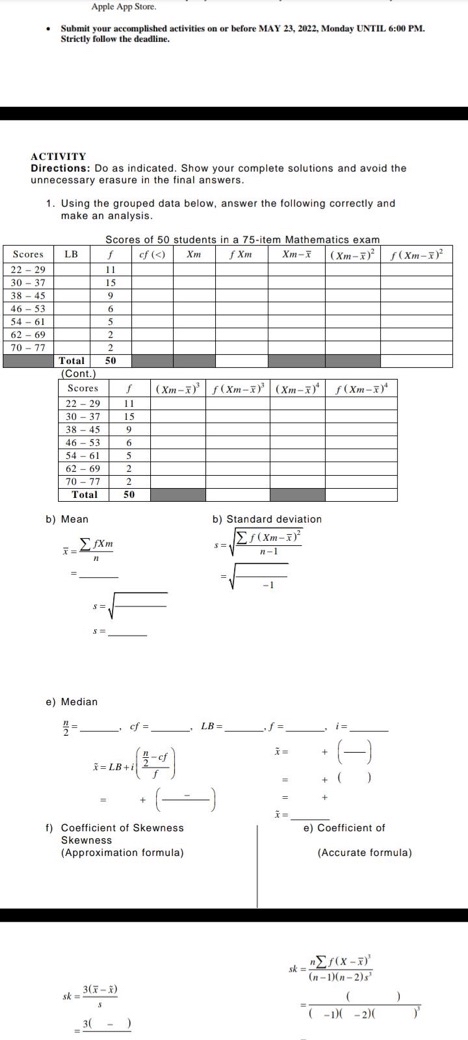
• Submit your accomplished activities on or before MAY 23, 2022, Monday UNTIL 6:00 PM.
Strictly follow the deadline.
ACTIVITY
Directions: Do as indicated. Show your complete solutions and avoid the
unnecessary erasure in the final answers.
1. Using the grouped data below, answer the following correctly and
make an analysis.
Scores of 50 students in a 75-item Mathematics exam
cf (<) Xm
f Xm
Scores
LB
f
22-29
11
30-37
15
38-45
9
46-53
6
54-61
5
62-69
2
70-77
2
Total 50
(Cont.)
Scores f (Xm-x)³¹ f(Xm-x) (Xm-x) f(Xm-X)
22-29
11
30-37 15
38-45
9
46-53
6
54-61
5
62-69
2
70-77
2
Total
50
b) Standard deviation
Σf(Xm-x)²
S=1
n-1
b) Mean
7=
fXm
21
n
S=
S=
e) Median
2/2=
sk=
LB=
-cf
(-)
= LB+i
f) Coefficient of Skewness
Skewness
(Approximation formula)
3(X-X)
3(
Xm-X (Xm-X) f(Xm-X)²
=
i=
+
+ ( J
e) Coefficient of
sk=
(Accurate formula).
nΣf(x-x)'
(n-1)(n-2)s
(
(-1)(-2)(
)
Expert Solution
This question has been solved!
Explore an expertly crafted, step-by-step solution for a thorough understanding of key concepts.

Step by stepSolved in 4 steps with 1 images

Knowledge Booster

Similar questions
- 3.1.15 Question Help ▼ Claim: The mean pulse rate (in beats per minute) of adult males is equal to 69 bpm. For a random sample of 155 adult males, the mean pulse rate is 68.3 bpm and the standard deviation is 10.8 bpm. Find the value of the test statistic. The value of the test statistic is (Round to two decimal places as needed.)arrow_forwardFind the equation of the least-squares regression line for the data found in Table 1.2. Lastly, are we able to find a line that outputs a smaller total of the sum of the residuals squared than the least-squares regression line, why or why not?arrow_forwardquestion(3): Anar scored 78 on a test that had a mean of 72 and a standard deviation of 2.7 . Omid score 66 that had a standard deviation of 1.3 (a) What is Anar Z score? (b)What is Omid z score? (c)Which Is higher Anar or Omid?arrow_forward
- Step 2 x x - mean (x-mean)2 20 20-35=-15 225 30 30-35=-5 25 40 40-35=5 25 50 50-35=15 225 n = 4 mean =35 Sum =500 Given the raw data 20, 30, 40, 50, fill in the table below to calculate the standard deviation using the SD formula (ROUND ALL DECIMAL ANSWERS TO THE NEAREST HUNDREDTH): 1)The square root of the quotient found is = 2) Divide the Sum of the last column you found by (n-1)= 166.77?? I BELIEVE THIS IS THE ANSWER. 3) The square root of the quotient found is S = 4) Because n<30, the value for the SD is S. That is, the standard deviation of the raw data is=arrow_forward4. Summary statistics for the data are shown in the table below. Меan Standard Deviation Iland, x 17.682 1.168 Foot, y 23.318 1.230 Pearson correlation r 0.948 (a) Find the slope by using the formula (b) Find the y-intercept by using the formula a = y – br (c) Find the regresssion equation, using the words "IHand" and "Foot," not r and y. (d) Using the regression equation, predict the foot length (in em) for someone who has a hand length of 18 cm.arrow_forwardPart C. To reduce the percentage of defective chips the company...arrow_forward
arrow_back_ios
arrow_forward_ios
Recommended textbooks for you
- MATLAB: An Introduction with ApplicationsStatisticsISBN:9781119256830Author:Amos GilatPublisher:John Wiley & Sons Inc
 Probability and Statistics for Engineering and th...StatisticsISBN:9781305251809Author:Jay L. DevorePublisher:Cengage Learning
 Statistics for The Behavioral Sciences (MindTap C...StatisticsISBN:9781305504912Author:Frederick J Gravetter, Larry B. WallnauPublisher:Cengage Learning
  Elementary Statistics: Picturing the World (7th E...StatisticsISBN:9780134683416Author:Ron Larson, Betsy FarberPublisher:PEARSON
 The Basic Practice of StatisticsStatisticsISBN:9781319042578Author:David S. Moore, William I. Notz, Michael A. FlignerPublisher:W. H. Freeman
 Introduction to the Practice of StatisticsStatisticsISBN:9781319013387Author:David S. Moore, George P. McCabe, Bruce A. CraigPublisher:W. H. Freeman
MATLAB: An Introduction with Applications
Statistics
ISBN:9781119256830
Author:Amos Gilat
Publisher:John Wiley & Sons Inc
Probability and Statistics for Engineering and th...
Statistics
ISBN:9781305251809
Author:Jay L. Devore
Publisher:Cengage Learning
Statistics for The Behavioral Sciences (MindTap C...
Statistics
ISBN:9781305504912
Author:Frederick J Gravetter, Larry B. Wallnau
Publisher:Cengage Learning
Elementary Statistics: Picturing the World (7th E...
Statistics
ISBN:9780134683416
Author:Ron Larson, Betsy Farber
Publisher:PEARSON
The Basic Practice of Statistics
Statistics
ISBN:9781319042578
Author:David S. Moore, William I. Notz, Michael A. Fligner
Publisher:W. H. Freeman
Introduction to the Practice of Statistics
Statistics
ISBN:9781319013387
Author:David S. Moore, George P. McCabe, Bruce A. Craig
Publisher:W. H. Freeman