MATLAB: An Introduction with Applications
6th Edition
ISBN: 9781119256830
Author: Amos Gilat
Publisher: John Wiley & Sons Inc
expand_more
expand_more
format_list_bulleted
Question

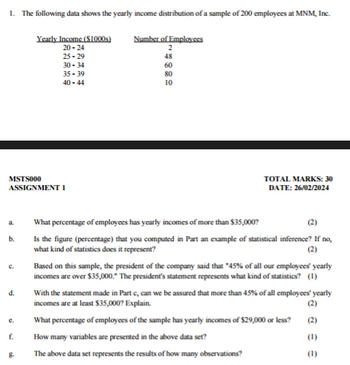
Transcribed Image Text:1. The following data shows the yearly income distribution of a sample of 200 employees at MNM, Inc.
Yearly Income ($1000s)
20-24
MSTS000
ASSIGNMENT 1
a.
b.
d.
e.
25-29
30-34
35-39
40-44
8.
Number of Employees
2
48
60
80
10
TOTAL MARKS: 30
DATE: 26/02/2024
What percentage of employees has yearly incomes of more than $35,000?
(2)
Is the figure (percentage) that you computed in Part an example of statistical inference? If no,
what kind of statistics does it represent?
(2)
Based on this sample, the president of the company said that "45% of all our employees' yearly
incomes are over $35,000." The president's statement represents what kind of statistics? (1)
With the statement made in Part c, can we be assured that more than 45% of all employees' yearly
incomes are at least $35,000? Explain.
(2)
(2)
(1)
(1)
What percentage of employees of the sample has yearly incomes of $29,000 or less?
How many variables are presented in the above data set?
The above data set represents the results of how many observations?
SAVE
AI-Generated Solution
info
AI-generated content may present inaccurate or offensive content that does not represent bartleby’s views.
Unlock instant AI solutions
Tap the button
to generate a solution
to generate a solution
Click the button to generate
a solution
a solution
Knowledge Booster
Similar questions
- Question 4The researcher wishes to use graphical descriptive methods to present summaries of the data on each of the two variables: hours worked per week and yearly income, as stored in file HOURSWORKED.jpga) The number of observations (n) is 65 individuals. The researcher suggests using 7 class intervals to construct a histogram for each variable. Explain how the researcher would have decided on the number of class intervals (K) as 7. b) The researcher suggests using class intervals as 10 < X ≤ 15, 15 < X ≤ 20, …, 40 < X ≤ 45 for the hours per week variable and class intervals 40 < X ≤ 45, 45 < X ≤ 50, ..., 70 < X ≤ 75 for the yearly income variable. Explain how the researcher would have decided the width of the above class intervals (or class width). c) Draw and display a histogram for each of the two variables using appropriate BIN values from part (b) and comment on the shape of the two distributions.arrow_forwardIn Table L-1, the total value of imports of Indonesian goods and services from China for the 2010-2019 period is reported on a quarterly basis. With this data you are asked to analyze it with the Trend model and Seasonal Index. Question: a. Calculate a moving average with the average period length of 4 or MA (4) [why four?] And put the results in a column. Beware of selecting the rows to place the average result. b. Calculate the moving average with the length of the average period is 2 from the data in column MA (4) and the result is given the symbol MA (2x4) and the result is placed in a column. Beware of selecting the rows to place the average result. c. Calculate the ratio to the Moving Average (Y / MA (2x4)) and place it in a new column! d. Calculate a seasonal index and interpret the results! e. Create a Deseasonalized data series and place it in a new column! f. Plot the Dessasonalized data series and read the long-term movement patterns of data! Remember that understanding of…arrow_forward(2) Based on the graph, describe the pattern of customer visits in store A and store B, respectively (4) If you are a manager from the company headquarters, how would you allocate the personnel resources to store A and store B, respectivelyarrow_forward
arrow_back_ios
arrow_forward_ios
Recommended textbooks for you
 MATLAB: An Introduction with ApplicationsStatisticsISBN:9781119256830Author:Amos GilatPublisher:John Wiley & Sons Inc
 Probability and Statistics for Engineering and th...StatisticsISBN:9781305251809Author:Jay L. DevorePublisher:Cengage Learning
 Statistics for The Behavioral Sciences (MindTap C...StatisticsISBN:9781305504912Author:Frederick J Gravetter, Larry B. WallnauPublisher:Cengage Learning
 Elementary Statistics: Picturing the World (7th E...StatisticsISBN:9780134683416Author:Ron Larson, Betsy FarberPublisher:PEARSON
 The Basic Practice of StatisticsStatisticsISBN:9781319042578Author:David S. Moore, William I. Notz, Michael A. FlignerPublisher:W. H. Freeman
 Introduction to the Practice of StatisticsStatisticsISBN:9781319013387Author:David S. Moore, George P. McCabe, Bruce A. CraigPublisher:W. H. Freeman

MATLAB: An Introduction with Applications
Statistics
ISBN:9781119256830
Author:Amos Gilat
Publisher:John Wiley & Sons Inc

Probability and Statistics for Engineering and th...
Statistics
ISBN:9781305251809
Author:Jay L. Devore
Publisher:Cengage Learning

Statistics for The Behavioral Sciences (MindTap C...
Statistics
ISBN:9781305504912
Author:Frederick J Gravetter, Larry B. Wallnau
Publisher:Cengage Learning

Elementary Statistics: Picturing the World (7th E...
Statistics
ISBN:9780134683416
Author:Ron Larson, Betsy Farber
Publisher:PEARSON

The Basic Practice of Statistics
Statistics
ISBN:9781319042578
Author:David S. Moore, William I. Notz, Michael A. Fligner
Publisher:W. H. Freeman

Introduction to the Practice of Statistics
Statistics
ISBN:9781319013387
Author:David S. Moore, George P. McCabe, Bruce A. Craig
Publisher:W. H. Freeman