
MATLAB: An Introduction with Applications
6th Edition
ISBN: 9781119256830
Author: Amos Gilat
Publisher: John Wiley & Sons Inc
expand_more
expand_more
format_list_bulleted
Related questions
Concept explainers
Topic Video
Question

Transcribed Image Text:4:35
b.elearningontario.ca AA
Done
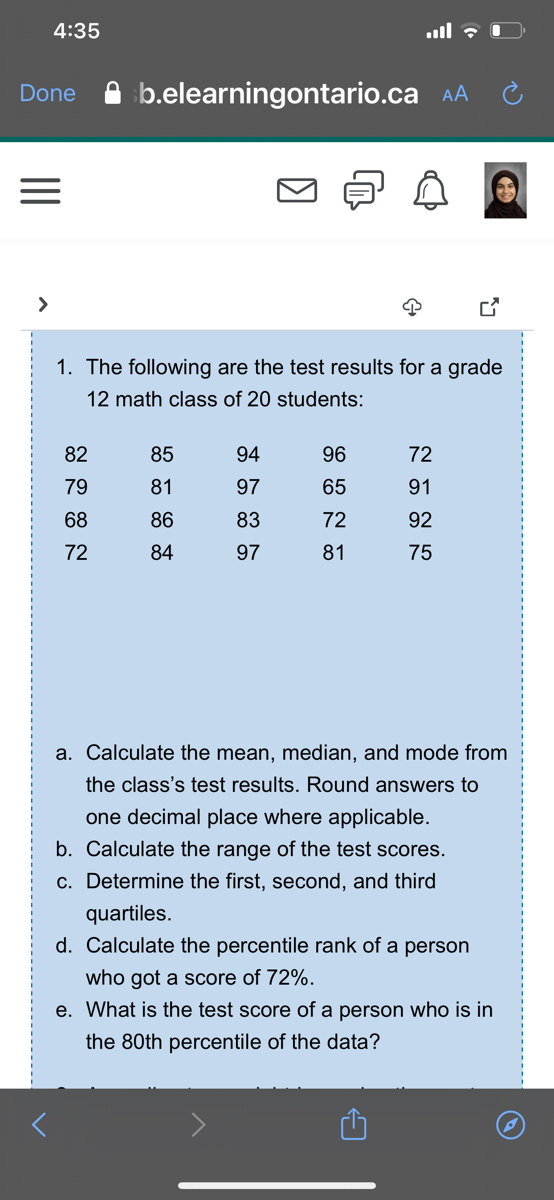
1. The following are the test results for a grade
12 math class of 20 students:
82
85
94
96
72
79
81
97
65
91
68
86
83
72
92
72
84
97
81
75
a. Calculate the mean, median, and mode from
the class's test results. Round answers to
one decimal place where applicable.
b. Calculate the range of the test scores.
c. Determine the first, second, and third
quartiles.
d. Calculate the percentile rank of a person
who got a score of 72%.
e. What is the test score of a person who is in
the 80th percentile of the data?
Expert Solution
This question has been solved!
Explore an expertly crafted, step-by-step solution for a thorough understanding of key concepts.

Step by stepSolved in 3 steps with 2 images

Knowledge Booster


Learn more about
Need a deep-dive on the concept behind this application? Look no further. Learn more about this topic, statistics and related others by exploring similar questions and additional content below.Similar questions
- Students in a statistics class took their first test. The following are the scores they earned. Fill in the stem-and-leaf plot below use the tens place as the stem and the ones place as the leaf. Describe the shape of the distribution. 73 84 95 91 98 97 90 74 74 82 63 79 82 88 74 88 67 81 83 69 73 95 91 94 86 56 94 62 a) Data were collected for variable(s). Is it appropriate to make a stem-and-leaf plot for this type of data and number of variables? . b) Complete the stem-and-leaf plot below. You must put commas between the leaves. Stems Leaves 5 c) What shape is the stem-and-leaf plot above?arrow_forwardWhich of the following percentiles represents the median of a data set? Select one: a. 100th b. 25th c. 50th d. 75tharrow_forwardSix damaged cars are selected and taken to bothgarages A and B for estimates. Find the 95% CI forthe difference between the population meanestimates for each garage. 1 2 3 4 5 6 A 890 900 910 710 990 650 B 880 1010 980 790 1042 600arrow_forward
- Determine whether the statement describes a descriptive or inferential statistic. A survey of 1478 people revealed that 52 % eat while they drive; therefore it can be assumed that 52 % of the U.S. population eats while they drive. 囲 Tables E Keypad Answer Keyboard Shortcu O Descriptive Statistic O Inferential Statisticarrow_forwardThe weights, in pounds, of packages on a delivery truck are shown in the stem-and-leaf plot. Find the mean, the median, and the mode of the data, if possible. If any measure cannot be found or does not represent the center of the data, explain why. ... OA. The mean is 0 36 1 0347 2 2333669 3 045556789 4 01346 5 5 Key: 30=30 Find the mean. Select the correct choice below and, if necessary, fill in the answer box to complete your choice. (Round to one decimal place as needed.) OB. The mean cannot be calculated because the sample size is too small. OC. The mean cannot be calculated because the data are at the nominal level of measurement. D. The mean cannot be calculated because there is an even number of data entries.arrow_forward(a) Determine the population mean pulse. The following data represent the pulse rates (beats per minute) of nine students enrolled in a statistics course. Treat the nine students as a population. Complete parts (a) through (c). The population mean pulse is approximately beats per minute. (Round to one decimal place as needed.) Student Pulse O Perpectual Bempah 76 Megan Brooks Jeff Honeycutt 80 85 Clarice Jefferson 75 Crystal Kurtenbach 60 Janette Lantka 64 Kevin McCarthy 79 Tammy Ohm 80 Kathy Wojdya 84arrow_forward
- Find the median and lower quartile of the number of wins of the Mariners for 6 years. Years and wins below: 2010/2011/2012/2013/2014/2015 71 61 72 86 89 95 A) Find the median. Show work. B) Find the lower quartile. Show work.arrow_forwardConsider the data set: 7 8 4 2 1 3 9 3 Find the mean: (Round your answer to 3 decimal places if necessary) Find the median: (Round your answer to 3 decimal places if necessary)arrow_forwardThe following stem-and-leaf plot represents scores on a university psychology test. If one more person was to take the test, which value would most likely represent the person's expected score? Stem Leaf 5 07 169 7 001258 8 359 24 O 57 O 66 O 70 O 85arrow_forward
- The scores and the percents of the final grade for a student in a stats class are given. What is the student's mean score? Complete the thirds columnarrow_forwardPlease give me answer immediately.arrow_forwardFind the 5 number summary for the data shown 17 21 29 30 36 42 56 60 88 91 94 97 5 number summary:Use the Locator/Percentile method described in your book, not your calculator.arrow_forward
arrow_back_ios
SEE MORE QUESTIONS
arrow_forward_ios
Recommended textbooks for you
- MATLAB: An Introduction with ApplicationsStatisticsISBN:9781119256830Author:Amos GilatPublisher:John Wiley & Sons Inc
 Probability and Statistics for Engineering and th...StatisticsISBN:9781305251809Author:Jay L. DevorePublisher:Cengage Learning
 Statistics for The Behavioral Sciences (MindTap C...StatisticsISBN:9781305504912Author:Frederick J Gravetter, Larry B. WallnauPublisher:Cengage Learning
  Elementary Statistics: Picturing the World (7th E...StatisticsISBN:9780134683416Author:Ron Larson, Betsy FarberPublisher:PEARSON
 The Basic Practice of StatisticsStatisticsISBN:9781319042578Author:David S. Moore, William I. Notz, Michael A. FlignerPublisher:W. H. Freeman
 Introduction to the Practice of StatisticsStatisticsISBN:9781319013387Author:David S. Moore, George P. McCabe, Bruce A. CraigPublisher:W. H. Freeman
MATLAB: An Introduction with Applications
Statistics
ISBN:9781119256830
Author:Amos Gilat
Publisher:John Wiley & Sons Inc
Probability and Statistics for Engineering and th...
Statistics
ISBN:9781305251809
Author:Jay L. Devore
Publisher:Cengage Learning
Statistics for The Behavioral Sciences (MindTap C...
Statistics
ISBN:9781305504912
Author:Frederick J Gravetter, Larry B. Wallnau
Publisher:Cengage Learning
Elementary Statistics: Picturing the World (7th E...
Statistics
ISBN:9780134683416
Author:Ron Larson, Betsy Farber
Publisher:PEARSON
The Basic Practice of Statistics
Statistics
ISBN:9781319042578
Author:David S. Moore, William I. Notz, Michael A. Fligner
Publisher:W. H. Freeman
Introduction to the Practice of Statistics
Statistics
ISBN:9781319013387
Author:David S. Moore, George P. McCabe, Bruce A. Craig
Publisher:W. H. Freeman