
MATLAB: An Introduction with Applications
6th Edition
ISBN: 9781119256830
Author: Amos Gilat
Publisher: John Wiley & Sons Inc
expand_more
expand_more
format_list_bulleted
Related questions
Question
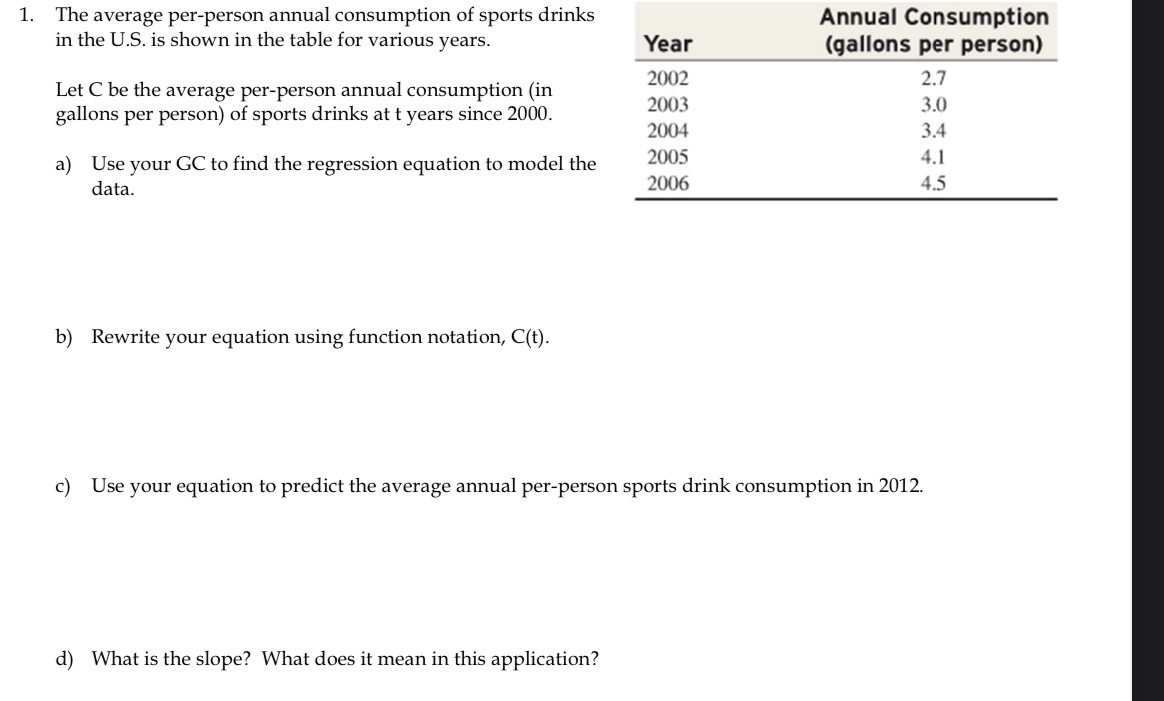

Transcribed Image Text:1. The average per-person annual consumption of sports drinks
in the U.S. is shown in the table for various years.
Let C be the average per-person annual consumption (in
gallons per person) of sports drinks at t years since 2000.
a) Use your GC to find the regression equation to model the
data.
b) Rewrite your equation using function notation, C(t).
Year
2002
2003
2004
2005
2006
d) What is the slope? What does it mean in this application?
Annual Consumption
(gallons per person)
2.7
3.0
3.4
4.1
4.5
c) Use your equation to predict the average annual per-person sports drink consumption in 2012.
Expert Solution
This question has been solved!
Explore an expertly crafted, step-by-step solution for a thorough understanding of key concepts.

Step by stepSolved in 5 steps with 1 images

Knowledge Booster

Similar questions
- X₁ is the The volume (in cubic feet) of a black cherry tree can be modeled by the equation y = -51.2 +0.4x₁ + 4.8x2, where tree's height (in feet) and x₂ is the tree's diameter (in inches). Use the multiple regression equation to predict the y-values for the values of the independent variables. (a) x₁ = 73, x₂ = 8.8 (b) x₁ = 67, x₂ = 11.5 (c) x₁ = 85, x₂ = 17.6 (d) x₁ = 92, x₂ = 20.8 cubic feet. (a) The predicted volume is (Round to one decimal place as needed.) (b) The predicted volume is cubic feet. (Round to one decimal place as needed.) (c) The predicted volume is cubic feet. (Round to one decimal place as needed.) (d) The predicted volume is cubic feet. (Round to one decimal place as needed.) Nextarrow_forwardThe annual expenditure for cell phones varies by the age of an individual. The average annual expenditure E(a) (in $) for individuals of age a (in years) is given below:a: 20, 30, 40, 50, 60, 70E(a): 502, 658, 649, 627, 476, 2131. Use quadratic regression to find the model that best represents the data.2. At what age is the yearly expenditure for cell phones the greatest? Round the answer to the nearest year. YOU MUST SHOW THE WORK FOR THIS PART!arrow_forwardUsing the regression to model annual income, a variable for years of education has a slope = 2000. This means that the model predicts each additional year of education will yield an extra 2,000 for the average person's salary, regardless of how many total years of education a person has. A. True B. Falsearrow_forward
arrow_back_ios
arrow_forward_ios
Recommended textbooks for you
- MATLAB: An Introduction with ApplicationsStatisticsISBN:9781119256830Author:Amos GilatPublisher:John Wiley & Sons Inc
 Probability and Statistics for Engineering and th...StatisticsISBN:9781305251809Author:Jay L. DevorePublisher:Cengage Learning
 Statistics for The Behavioral Sciences (MindTap C...StatisticsISBN:9781305504912Author:Frederick J Gravetter, Larry B. WallnauPublisher:Cengage Learning
  Elementary Statistics: Picturing the World (7th E...StatisticsISBN:9780134683416Author:Ron Larson, Betsy FarberPublisher:PEARSON
 The Basic Practice of StatisticsStatisticsISBN:9781319042578Author:David S. Moore, William I. Notz, Michael A. FlignerPublisher:W. H. Freeman
 Introduction to the Practice of StatisticsStatisticsISBN:9781319013387Author:David S. Moore, George P. McCabe, Bruce A. CraigPublisher:W. H. Freeman
MATLAB: An Introduction with Applications
Statistics
ISBN:9781119256830
Author:Amos Gilat
Publisher:John Wiley & Sons Inc
Probability and Statistics for Engineering and th...
Statistics
ISBN:9781305251809
Author:Jay L. Devore
Publisher:Cengage Learning
Statistics for The Behavioral Sciences (MindTap C...
Statistics
ISBN:9781305504912
Author:Frederick J Gravetter, Larry B. Wallnau
Publisher:Cengage Learning
Elementary Statistics: Picturing the World (7th E...
Statistics
ISBN:9780134683416
Author:Ron Larson, Betsy Farber
Publisher:PEARSON
The Basic Practice of Statistics
Statistics
ISBN:9781319042578
Author:David S. Moore, William I. Notz, Michael A. Fligner
Publisher:W. H. Freeman
Introduction to the Practice of Statistics
Statistics
ISBN:9781319013387
Author:David S. Moore, George P. McCabe, Bruce A. Craig
Publisher:W. H. Freeman