Question
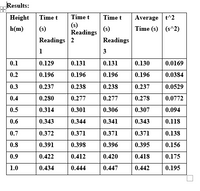
1. Plot a suitable graph
2.calculate the slope of the graph
3. Determine a value for g, the acceleration due to gravity
4.Determine the percentage difference between your experimentally determined value and the accepted
value for g

Transcribed Image Text:Results:
Average t^2
Time (s) (s^2)
Height
Time t
Time t
Time t
(s)
Readings
h(m)
(s)
(s)
Readings 2
Readings
1
3
0.1
0.129
0.131
0.131
0.130
0.0169
0.2
0.196
0.196
0.196
0.196
0.0384
0.3
0.237
0.238
0.238
0.237
0.0529
0.4
0.280
0.277
0.277
0.278
0.0772
0.5
0.314
0.301
0.306
0.307
0.094
0.6
0.343
0.344
0.341
0.343
0.118
0.7
0.372
0.371
0.371
0.371
0.138
0.8
0.391
0.398
0.396
0.395
0.156
0.9
0.422
0.412
0.420
0.418
0.175
1.0
0.434
0.444
0.447
0.442
0.195

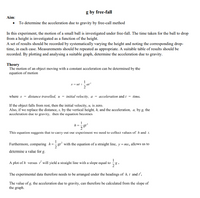
Transcribed Image Text:g by free-fall
Aim:
• To determine the acceleration due to gravity by free-call method
In this experiment, the motion of a small ball is investigated under free-fall. The time taken for the ball to drop
from a height is investigated as a function of the height.
A set of results should be recorded by systematically varying the height and noting the corresponding drop-
time, in each case. Measurements should be repeated as appropriate. A suitable table of results should be
recorded. By plotting and analysing a suitable graph, determine the acceleration due to gravity.
Theory
The motion of an object moving with a constant acceleration can be determined by the
equation of motion
1
ut i
at
where s = distance travelled, u = initial velocity, a = acceleration and t = time.
If the object falls from rest, then the initial velocity, u, is zero.
Also, if we replace the distance, s, by the vertical height, h, and the acceleration, a, by g, the
acceleration due to gravity, then the equation becomes
This equation suggests that to carry out our experiment we need to collect values of h and 1.
Furthermore, comparing h=gr² with the equation of a straight line, y=mx, allows us to
determine a value for g.
1
A plot of h versus will yield a straight line with a slope equal to
The experimental data therefore needs to be arranged under the headings of h, t and r.
The value of g, the acceleration due to gravity, can therefore be calculated from the slope of
the graph.
Expert Solution
This question has been solved!
Explore an expertly crafted, step-by-step solution for a thorough understanding of key concepts.
Step by stepSolved in 2 steps with 3 images

Knowledge Booster
Similar questions
- Describe your approach to calculating the velocity of a satellite in an orbit of radius R around the Earth. Select as many options as you think are appropriate. a. Use Newton's second law. O b. Use Kepler's second law. ☐ c. Use Newton's law of universal gravitation. d. Use Kepler's first law.arrow_forward9. True or False questions. Circle the correct answer. a. An example of a Vector is Temperature. TRUE or FALSE b. In a vacuum, Heavier objects fall faster than lighter objects. TRUE or FALSE C. X values and Y values can be determined independently when performing calculations using Galileo's kinetic equations. TRUE or FALSE d. Static friction is a force that applied to object that is stationary. TRUE or FALSE e. When a spring is compressed, the spring is said to have potential energy. TRUE or FALSE f. A car crash is an example of an Impulse. TRUE or FALSE g. Centripetal force is not a new force. It is any combination of forces that cause an object to follow a path of circular motion. TRUE or FALSE h. Consider the following shapes: Cylinder, Hoop, Solid sphere, and spherical shell. The cylind has the greatest inertia. TRUE or FALSEarrow_forwardA 1kg rock is taken on Moon from Earth. Acceleration due to gravity (g) on Moon is 1.6m/s2.. What will be mass of rock on Moon and what will be weight of rock on Moon? Choose one correct answer with correct unit of measure of mass and weight . A. Mass = 1kg , Weight = 1.6 N B. Mass = 9.8 pounds , Weight = 1.6 kg C. Mass = 1.6 kg , Weight = 9.8N D. Mass = 1 pound , Weight = 1.6 poundsarrow_forward
- 2. Give three examples that demonstrate Newton's third law of motion. Explain how each example demonstrates the law.arrow_forwardA rock has a mass of 17 kg on a planet. The acceleration due to gravity (g) on the planet is 7m/s^2.. Assuming the rock does not physically change, how much mass will it have on Earth? Choose one correct answer with correct unit of measure. A. 116.6 kg B. 17 kg C. 119 pounds D. 17 Narrow_forward6. Use Kepler's laws to calculate the mass of the Sun based on data for average Earth's orbit and compare the value obtained with the Sun's commonly listed value of 1.989 × 1030 kg.arrow_forward
- Determine the acceleration of gravity g using your (a) position versus time graph equation (b) velocity versus time graph equation. A Equation: y=-4.2238t^2-1.2466t+1.0791 B Equation: y=-8.152x-1.2934arrow_forwardAccording to Newton’s law of universal gravitation, if the distance between two objects is doubled, the force of gravity between them will a. double. b. be cut in half. c. be one-fourth as great. d. remain unchanged.arrow_forward
arrow_back_ios
arrow_forward_ios