Question
thumb_up100%

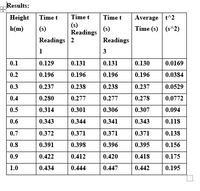
Transcribed Image Text:Results:
Average t^2
Time (s) (s^2)
Height
Time t
Time t
Time t
(s)
Readings
h(m)
(s)
(s)
Readings 2
Readings
1
3
0.1
0.129
0.131
0.131
0.130
0.0169
0.2
0.196
0.196
0.196
0.196
0.0384
0.3
0.237
0.238
0.238
0.237
0.0529
0.4
0.280
0.277
0.277
0.278
0.0772
0.5
0.314
0.301
0.306
0.307
0.094
0.6
0.343
0.344
0.341
0.343
0.118
0.7
0.372
0.371
0.371
0.371
0.138
0.8
0.391
0.398
0.396
0.395
0.156
0.9
0.422
0.412
0.420
0.418
0.175
1.0
0.434
0.444
0.447
0.442
0.195

Transcribed Image Text:10. Plot a suitable graph.
11. Calculate the slope of the graph.
12. Determine a value for g, the acceleration due to gravity.
13. Determine the percentage difference between your experimentally determined value and the accepted
value for g.
Expert Solution
This question has been solved!
Explore an expertly crafted, step-by-step solution for a thorough understanding of key concepts.
Step by stepSolved in 4 steps with 1 images

Knowledge Booster
Similar questions
- For a short time, the speed v of a car, in m / s, is given by v = at2 + bt3, where t is the time in seconds. The units of a and b are, respectively, a) m/s^2; m/s^3 b) m/s^4; m/s^5 c) s^3/m; s^4/m d) m.s^2; m.s^4 e) m/s^3; m/s^4arrow_forward2x + 3y = 4 3x - y = -5 x= ? y=?arrow_forwardDuring 55 successive 1.001.00 min intervals, a runner moves at the following constant speeds: 0.4000.400 km/min, 0.2000.200 km/min, 0.1100.110 km/min, 0.1100.110 km/min, and 0.3600.360 km/min. a.) Find the total distance traveled. b.) Find the average speed.arrow_forward
- Two automobiles are 150 kilometers apart and traveling toward each other. One automobile is moving at 35 km/h and the other is moving at 40 km/h. In how many hours will they meet? A) 2.5 h B) 2.0 h C) 1.75 h D) 1.5 h F) 1.25 harrow_forward3. A tennis ball is thrown up in the air. It's height is given by h(t) = -5t2 + 23t + 2, where h(t) is in meters and t is in seconds. Use technology to answer: a.) What is the max height of the tennis ball? When does it occur? b.) How long was the tennis ball in the air?arrow_forwardAn object's velocity as a function of time in one dimension is given by the expression; v(t) = 3.8t + 6.68 where are constants have proper SI Units. At what time is the object's velocity 61.2 m/s?arrow_forward
arrow_back_ios
arrow_forward_ios