
MATLAB: An Introduction with Applications
6th Edition
ISBN: 9781119256830
Author: Amos Gilat
Publisher: John Wiley & Sons Inc
expand_more
expand_more
format_list_bulleted
Related questions
Question
thumb_up100%
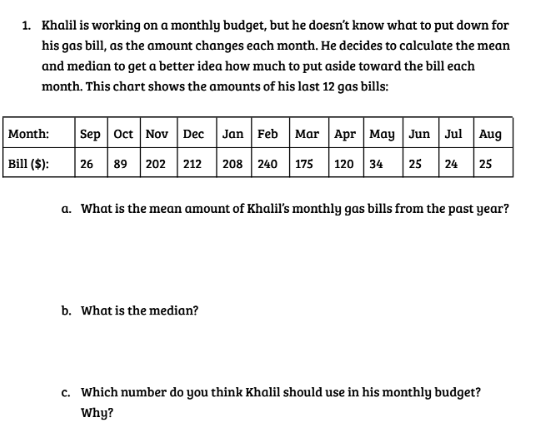

Transcribed Image Text:1. Khalil is working on a monthly budget, but he doesn't know what to put down for
his gas bill, as the amount changes each month. He decides to calculate the mean
and median to get a better idea how much to put aside toward the bill each
month. This chart shows the amounts of his last 12 gas bills:
Month:
Bill ($):
Sep Oct Nov Dec Jan Feb Mar Apr May Jun Jul Aug
26 89 202 212 208 240 175 120 34 25 24 25
a. What is the mean amount of Khalil's monthly gas bills from the past year?
b. What is the median?
c. Which number do you think Khalil should use in his monthly budget?
Why?
Expert Solution
This question has been solved!
Explore an expertly crafted, step-by-step solution for a thorough understanding of key concepts.

This is a popular solution

Trending nowThis is a popular solution!

Step by stepSolved in 5 steps

Knowledge Booster

Similar questions
- The table shows the motor vehicle deaths in the United States by year from 2010 through 2018. a) What is the frequency of deaths measured from 2010 through 2018? b) What percentage of deaths occurred after 2016? c) What is the relative frequency of deaths that occurred in 2012 or before? d) What is the percentage of deaths that occurred in 2015? e) What is the cumulative relative frequency for 2016? Explain what this number tells you about the data. Year Deaths 2010 32899 2011 32479 2012 33782 2013 32893 2014 32744 2015 35425 2016 37806 2017 37133 2018 36560 Show your work below. Round relative and cumulative frequencies to 3 decimal places and percents to 1 decimal place.arrow_forwardshould have the right to marry. (The 2014 data were collected before the 2015 U.S. C2. GSS 2014 and GSS 2018 respondents were asked their opinion on whether homosexuals 30 measured on a 5-point scale from strongly agree (1) to strongly disagree (5). Supreme Court decision granting same-sex couples the right to marry. Responses wer measured on a 5-point scale from strongly agree (1) to strong!y aisagiee (2). Cumulative Percentage Homosexuals Should Have Right to Marry (2014) Percentage Frequency 32.5 32.5 Strongly agree 251 57.5 25.2 Agree 195 67.3 Neither agree nor disagree 9.6 74 79.2 Disagree 92 11.9 100.0 Strongly disagree 161 20.8 Total 773 100.0 Homosexuals Should Have Cumulative Right to Marry (2018) Frequency Percentage Percentage Strongly agree 293 39.5 39.5 Agree 200 27.0 66.5 Neither agree nor disagree 70 9.4 75.9 Disagree 67 9.0 84.9 Strongly disagree 111 15.0 99.9 Total 741 99.9 a. What is the level of measurement for this variable? b. What is the mode for 2014? For 2018?arrow_forwardActual lengths of stay at a hospital's emergency department in 2009 are shown in the following table (rounded to the nearest hour). Length of stay is the total of wait and service times. Some longer stays are also approximated as 15 hours in this table. Hours Count Percent 1 17 3.40 2 53 10.60 88 17.60 101 20.20 84 16.80 64 12.80 44 8.80 16 3.20 9 12 2.40 10 14 2.80 15 7 1.40 Determine the cumulative distribution function for the random variable. x x < 1 1 < x < 2 F(x) i i 3 < x < 4 4 < x < 5 i 6arrow_forward
- The prices vary depending on the condition of the radio. $210, $210, $320, $200, $300, $10, $340, $300, $245, $325, $700, $250, $240, $200 a. Find the mean of the radio prices. Round to the nearest cent.arrow_forwardUse this dataset for your analysis software.Cost-to-charge ratio (the percentage of the amount billed that represents the actual cost) for inpatient and outpatient services at 11 Oregon hospitals is shown in the following table. A scatterplot of the data is also shown. Cost-to-Charge Ratio Hospital OutpatientCare InpatientCare 1 62 80 2 66 76 3 63 75 4 51 62 5 75 100 6 65 88 7 56 64 8 45 50 9 48 54 10 71 83 11 54 100 The least-squares regression line with y = inpatient cost-to-charge ratio and x = outpatient cost-to-charge ratio is = -1.1 + 1.29 x. (a) Is the observation for Hospital 11 an influential observation? Yes or No (b) Is the observation for Hospital 11 an outlier? Yes or No (c) Is the observation for Hospital 5 an influential observation? Yes or No (d) Is the observation for Hospital 5 an outlier? Yes or Noarrow_forwardThe comparison line graph indicates the rainfall for the last six months of two different 2013 years in Nowhereville. How many more inches of rain fell in October 2013 than in September 2013? 2014 04 July Aug Sept Oct Nov Dec Month ..... inch(es) (Simplify your answer.) Rainfall (in inches)arrow_forward
- The data in the accompanying table represent the total rates of return (in percentages) for three stock exchanges over the four-year period from 2009 to 2012. Calculate the geometric mean rate of return for each of the three stock exchanges. Click the icon to view data table for total rate of return for stock market indices. Click the icon to view data table for total rate of return for platinum, gold, and silver. a. Compute the geometric mean rate of return per year for the stock indices from 2009 through 2012. For stock exchange A, the geometric mean rate of return for the four-year period 2009-2012 was %. (Type an integer or decimal rounded to two decimal places as needed.) Data table for total rate of return Year A B C 2012 6.52 13.15 15.93 2011 4.79 0.00 -2.47 2010 10.00 11.85 16.38 2009 18.63 23.62 43.12 Print Done - X C Geometric mean rate of return for stock market indices Metal Platinum Gold Silver Geometric mean rate of return D 13.54% 15.78% 20.52% Print Done Xarrow_forwardThe value of a certain car when it was brand new with 0 mileage was $17,000 but the value dropped to $4,000 when the car acounulated 80,000 miles shown in the scatter plot below. Car's Mleage and Value S17.000 $2,000 Mileage Based on the data in the scatter plot, at what mileage was the car worth about $12,000? O 20,000 miles O 30,000 miles O 60,000 miles O 80,000 milesarrow_forwardA sales manager collected the following data on annual sales and years of experience. Annual Sales ($1000s) 80 Salesperson Years of Experience 1 1 4 102 3 6 103 4 10 119 5 13 136arrow_forward
- Complete the table to the right. Grade on Business Statistics Exam Frequency Relative Frequency A: 90-100 0.08 B: 80-89 C: 65-79 69 111 D: 50-64 54 F: Below 50 42 Total 300 1.00 Grade on Business Statistics Exam Frequency Relative Frequency A: 90-100 24 0.08 B: 80-89 69arrow_forwardPlease give me answer immediately.arrow_forwardA sales manager collected the following data on annual sales and years of experience. Annual Sales ($1000s) 80 Salesperson Years of Experience 1 1 4 102 3 6 103 4 10 119 5 13 136arrow_forward
arrow_back_ios
SEE MORE QUESTIONS
arrow_forward_ios
Recommended textbooks for you
- MATLAB: An Introduction with ApplicationsStatisticsISBN:9781119256830Author:Amos GilatPublisher:John Wiley & Sons Inc
 Probability and Statistics for Engineering and th...StatisticsISBN:9781305251809Author:Jay L. DevorePublisher:Cengage Learning
 Statistics for The Behavioral Sciences (MindTap C...StatisticsISBN:9781305504912Author:Frederick J Gravetter, Larry B. WallnauPublisher:Cengage Learning
  Elementary Statistics: Picturing the World (7th E...StatisticsISBN:9780134683416Author:Ron Larson, Betsy FarberPublisher:PEARSON
 The Basic Practice of StatisticsStatisticsISBN:9781319042578Author:David S. Moore, William I. Notz, Michael A. FlignerPublisher:W. H. Freeman
 Introduction to the Practice of StatisticsStatisticsISBN:9781319013387Author:David S. Moore, George P. McCabe, Bruce A. CraigPublisher:W. H. Freeman
MATLAB: An Introduction with Applications
Statistics
ISBN:9781119256830
Author:Amos Gilat
Publisher:John Wiley & Sons Inc
Probability and Statistics for Engineering and th...
Statistics
ISBN:9781305251809
Author:Jay L. Devore
Publisher:Cengage Learning
Statistics for The Behavioral Sciences (MindTap C...
Statistics
ISBN:9781305504912
Author:Frederick J Gravetter, Larry B. Wallnau
Publisher:Cengage Learning
Elementary Statistics: Picturing the World (7th E...
Statistics
ISBN:9780134683416
Author:Ron Larson, Betsy Farber
Publisher:PEARSON
The Basic Practice of Statistics
Statistics
ISBN:9781319042578
Author:David S. Moore, William I. Notz, Michael A. Fligner
Publisher:W. H. Freeman
Introduction to the Practice of Statistics
Statistics
ISBN:9781319013387
Author:David S. Moore, George P. McCabe, Bruce A. Craig
Publisher:W. H. Freeman