
ENGR.ECONOMIC ANALYSIS
14th Edition
ISBN: 9780190931919
Author: NEWNAN
Publisher: Oxford University Press
expand_more
expand_more
format_list_bulleted
Related questions
Concept explainers
Question
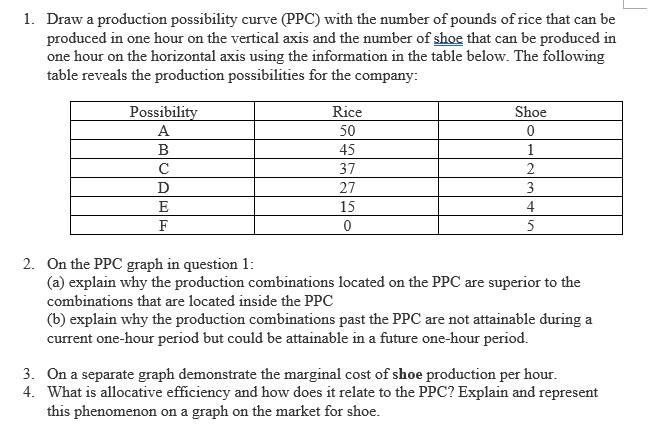

Transcribed Image Text:1. Draw a production possibility curve (PPC) with the number of pounds of rice that can be
produced in one hour on the vertical axis and the number of shoe that can be produced in
one hour on the horizontal axis using the information in the table below. The following
table reveals the production possibilities for the company:
Possibility
Rice
Shoe
А
50
В
45
1
37
2
D
27
3
E
15
4
F
2. On the PPC graph in question 1:
(a) explain why the production combinations located on the PPC are superior to the
combinations that are located inside the PPC
(b) explain why the production combinations past the PPC are not attainable during a
current one-hour period but could be attainable in a future one-hour period.
3. On a separate graph demonstrate the marginal cost of shoe production per hour.
4. What is allocative efficiency and how does it relate to the PPC? Explain and represent
this phenomenon on a graph on the market for shoe.
Expert Solution
This question has been solved!
Explore an expertly crafted, step-by-step solution for a thorough understanding of key concepts.

This is a popular solution

Trending nowThis is a popular solution!

Step by stepSolved in 2 steps with 1 images

Knowledge Booster


Learn more about
Need a deep-dive on the concept behind this application? Look no further. Learn more about this topic, economics and related others by exploring similar questions and additional content below.Similar questions
- G, 10arrow_forward8. A small bakery makes baguettes and muffins. With the resources available (workers, flour, machines) this bakery can produce either 1500 baguettes or 2000 muffins per day. a. What is the opportunity cost of an extra muffin in terms of baguettes? b. Assume that production is currently 1200 muffins and 600 baguettes. If the bakery wanted to expand its muffin production to 1300 muffins per day, how many baguettes would be baked?arrow_forward5. China is able to produce turnips and potatoes in combinations represented by the following table. (Each number represents 1,000s of bushes.) Potatoes Production Turnips point a. B C D E b. C. points. 100 and 0 90 and 10 and 20 and 30 and 40 70 40 0 Plot the data on a production possibilities graph, labeling Can China produce a combination of 30 turnips and 24 potatoes? Draw this production point on the graph (label it F) and verbally explain. Demonstrate that China experiences increasing opportunity costs by calculating the opportunity cost of producing another potato at each production point. Explain.arrow_forward
- 1arrow_forward#40arrow_forward5. Opportunity cost and production possibilities Edison is a skilled toy maker who is able to produce both boats and puzzles. He has 8 hours a day to produce toys. The following table shows the daily output resulting from various possible combinations of his time. ^ Hours Producing Produced Choice (Boats) (Puzzles) (Boats) (Puzzles) A 8 0 4 0 B 6 2 3 10 C 4 4 2 16 D 2 6 1 19 E 0 8 0 20 On the following graph, use the blue points (circle symbol) to plot Edison's initial production possibilities frontier (PPF). 9 &arrow_forward
- Bill and Melinda work for a firm that creates web pages and apps. The number of web page designs and apps each can produce in a week is given in the table below. Output per Week web pages designed apps created Bill 3 12 Melinda 2 4 Melinda’s opportunity cost of designing one web page is: Group of answer choices designing 2 apps designing 3 apps designing 4 apps designing 5 appsarrow_forwardE4arrow_forwardBob and Cho are farmers. Each one owns a 20-acre plot of land. The following table shows the amount of corn and rye each farmer can produce per year on a given acre. Each farmer chooses whether to devote all acres to producing corn or rye or to produce corn on some of the land and rye on the rest. Corn Rye (Bushels per acre) (Bushels per acre) Bob 10 5 Cho 40 8 On the following graph, use the blue line (circle symbol) to plot Bob's production possibilities frontier (PPF), and use the purple line (diamond symbol) to plot Cho's PPF. 200 Bob's PPF 180 160 F3 0+ F4 H r F5 M F7 1 F8 # F9 CI F10arrow_forward
- FIGURE 2-10 Wheat (bushels) Apples (bushels) 0 Refer to Figure 2-10. What movement along the production possibilities curve best illustrates the notion "To get more apples, we have to give up wheat"? 4 a movement from Point A to Point E a movement from Point E to Point C a movement from Point A to Point D a movement from Point B to Point Earrow_forwardCan I have help finding the solution?arrow_forward5. Opportunity cost and production possibilities Raphael is a skilled toy maker who is able to produce both trucks and kites. He has 8 hours a day to produce toys. The following table shows the daily output resulting from various possible combinations of his time. Choice Hours Producing Produced (Trucks) (Kites) (Trucks) (Kites) A 8 0 4 0 B 6 2 3 10 C 4 4 2 16 D 2 6 1 19 E 0 8 0 20 On the following graph, use the blue points (circle symbol) to plot Raphael's initial production possibilities frontier (PPF). ( attached image) Suppose Raphael is currently using combination D, producing one truck per day. His opportunity cost of producing a second truck per day is( 1, 3, 16, 19 kites) per day. Now, suppose Raphael is currently using combination C, producing two trucks per day. His opportunity cost of producing a third truck per day is ( 1,6,10, or 16 kites) per day. From the previous analysis, you can determine that as…arrow_forward
arrow_back_ios
SEE MORE QUESTIONS
arrow_forward_ios
Recommended textbooks for you
 Principles of Economics (12th Edition)EconomicsISBN:9780134078779Author:Karl E. Case, Ray C. Fair, Sharon E. OsterPublisher:PEARSON
 Engineering Economy (17th Edition)EconomicsISBN:9780134870069Author:William G. Sullivan, Elin M. Wicks, C. Patrick KoellingPublisher:PEARSON
 Principles of Economics (MindTap Course List)EconomicsISBN:9781305585126Author:N. Gregory MankiwPublisher:Cengage Learning
 Managerial Economics: A Problem Solving ApproachEconomicsISBN:9781337106665Author:Luke M. Froeb, Brian T. McCann, Michael R. Ward, Mike ShorPublisher:Cengage Learning
 Managerial Economics & Business Strategy (Mcgraw-...EconomicsISBN:9781259290619Author:Michael Baye, Jeff PrincePublisher:McGraw-Hill Education
Principles of Economics (12th Edition)
Economics
ISBN:9780134078779
Author:Karl E. Case, Ray C. Fair, Sharon E. Oster
Publisher:PEARSON
Engineering Economy (17th Edition)
Economics
ISBN:9780134870069
Author:William G. Sullivan, Elin M. Wicks, C. Patrick Koelling
Publisher:PEARSON
Principles of Economics (MindTap Course List)
Economics
ISBN:9781305585126
Author:N. Gregory Mankiw
Publisher:Cengage Learning
Managerial Economics: A Problem Solving Approach
Economics
ISBN:9781337106665
Author:Luke M. Froeb, Brian T. McCann, Michael R. Ward, Mike Shor
Publisher:Cengage Learning
Managerial Economics & Business Strategy (Mcgraw-...
Economics
ISBN:9781259290619
Author:Michael Baye, Jeff Prince
Publisher:McGraw-Hill Education