
ENGR.ECONOMIC ANALYSIS
14th Edition
ISBN: 9780190931919
Author: NEWNAN
Publisher: Oxford University Press
expand_more
expand_more
format_list_bulleted
Related questions
Question
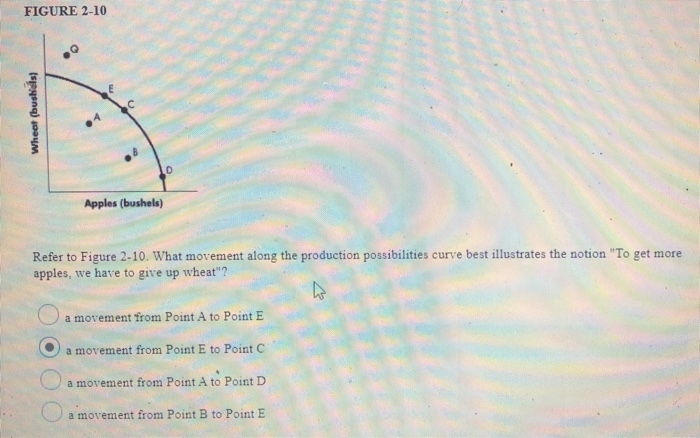

Transcribed Image Text:FIGURE 2-10
Wheat (bushels)
Apples (bushels)
0
Refer to Figure 2-10. What movement along the production possibilities curve best illustrates the notion "To get more
apples, we have to give up wheat"?
4
a movement from Point A to Point E
a movement from Point E to Point C
a movement from Point A to Point D
a movement from Point B to Point E
Expert Solution
This question has been solved!
Explore an expertly crafted, step-by-step solution for a thorough understanding of key concepts.

Step by stepSolved in 3 steps

Knowledge Booster


Learn more about
Need a deep-dive on the concept behind this application? Look no further. Learn more about this topic, economics and related others by exploring similar questions and additional content below.Similar questions
- 1 Use the equations given below and calculate total benefit, total cost, marginal benefit, and marginal cost for values of Q ranging from 35 to 45 Total Benefits: P = 314Q – 16Q Marginal Benefits: P = 314 – 32Q Total Cost: P = 50Q + 17Q Marginal Cost: P = 50 + 34Q 1) Graph total benefit and total cost on one graph, and marginal benefit and marginal cost on the other graph 2) Find the optimal value of Q and P 3) Calculate the total benefit, total cost, and net benefit at the equilibriumarrow_forward1arrow_forward1. Bob needs to decide whether to go home or go to the library. At home, his menu is H = {a,b,c} where a is study, b is watch TV, and c is surf the Internet. In the library, his menu is L = {a,c}. Let u(a) = 10, u(b) = 0, u(c) = 2 and v(a) = 0, v(b) = 8 and v(c) = 4. Then the multi-self model implies that (A) Bob will go to the library and surf the Internet there; (B) Bob will go to the library and study there; (C) Bob will go home and study; (D) Bob will go home and watch TV. 2. The costly self-control model implies that (A) Bob will go to the library and surf the Internet there; (B) Bob will go to the library and study there; (C) Bob will go home and study; (D) Bob will go home and watch TV.arrow_forward
- 45 PPF2 i of PPF1 Quantity of Tacos Which of the following most likely caused the shift from PPF1 to PPF2 shown in the diagram? Select one: a. An increase in resources. b. Better technology for both tacos and sushi. C. Better sushi technology. d. Better taco technology. Quantity of Sushiarrow_forwardCrystal is a talented artist who sells hand-crafted goods on her website. Crystal currently crafts and sells both tea towels and baskets. She spends 8 hours a day working on crafts. The following table gives different daily output scenarios depending on how much of her time is spent on each good. BASKETS Choice (Tea towels) A B C D E 30 25 20 15 10 5 Hours Crafting 0 0 8 6 4 2 0 On the following graph, use the blue points (circle symbol) to plot Crystal's initial production possibilities frontier (PPF). 2 (Baskets) (Tea towels) 0 2 4 6 8 3 4 TEA TOWELS 5 4 3 6 2 1 0 Produced 7 (Baskets) 0 10 16 19 8 20 Initial PPF New PPFarrow_forwardI am struggling with the graphsarrow_forward
- G, 10arrow_forward5. China is able to produce turnips and potatoes in combinations represented by the following table. (Each number represents 1,000s of bushes.) Potatoes Production Turnips point a. B C D E b. C. points. 100 and 0 90 and 10 and 20 and 30 and 40 70 40 0 Plot the data on a production possibilities graph, labeling Can China produce a combination of 30 turnips and 24 potatoes? Draw this production point on the graph (label it F) and verbally explain. Demonstrate that China experiences increasing opportunity costs by calculating the opportunity cost of producing another potato at each production point. Explain.arrow_forwardProblem 3 (a) Suppose that when Jane is presented with the following two menus, her choices from them are as below 2 • When presented with the menu {6 units of apples, 5 units of bananas}, Jane chooses 6 units of apples. • When presented with the menu {7 units of oranges, 5 units of bananas}, Jane chooses 5 units of bananas. Suppose that Jane is then presented with the menu {7 units of oranges, 6 units of apples} What must Jane's choice be from this menu so that her behavior conforms to the axioms of rational choice? Explain. (b) Suppose that Frederick choices from the following menus are as follows • For any e > 0³, out of the menu {(4 + ɛ apples and 3 bananas), (5 oranges and 3 bananas)}, Frederick chooses (4 + ε apples and 3 bananas). • Out of the menu {(4 apples and 3 bananas), (5 oranges and 3 bananas)}, Fred- erick chooses (5 oranges and 3 bananas) What axiom of rational choice does Frederick's behavior evidently violate? Discuss.arrow_forward
- Problem 1: Production Possibilities Frontier Consider an economy that produces bicycles and autos. The production possibilities schedule shown below denotes the points on the production possibilities frontier. Points Amount Bicycles Amount Autos A 10 B 8 D E 5 8 12 14 15 a) Draw the production possibilities frontier in a clearly labelled graph. You can assume the points on the frontier are connected by straight lines. Please put bicycles on the x-axis and autos on the y-axis. b) Is point E more efficient in production than point C? Explain. c) Based on this production possibility frontier, can the economy currently produce 8 bicycles and 10 autos? If not, explain what would need to happen to allow the economy to produce 8 bicycles and 10 autos. d) True/False/Uncertain (and explain): Point B more efficient in allocation than point A. e) Does this production frontier have increasing opportunity costs? Explain, and also explain why it is common for production frontiers to have increasing…arrow_forwardBased on the figure attached, please answer below questions What this figure represents. Explain. How does the above curve illustrate the tradeoff we must make to increase food productionarrow_forward9.) Suppose that Bob still has 10 hours and can produce 10 hamburgers in 1 hour or 2 plates of pasta in one hour. Jimmy also has 10 hours. He can produce 4 hamburgers in 1 hour or 1 plates of pasta in one hour. Which of the following is TRUE? a.) Jimmy has absolute advantage in production of pasta b.) Jimmy has absolute advantage in production of hamburgers c.) Jimmy has comparative advantage in production of pasta d.) Jimmy has comparative advantage in production of hamburgers 10.) If Bob and Jimmy from question 9 were to trade and mutually benefit, then: a.) Bob should specialize in making pasta b.) Jimmy should specialize in making pasta c.) The terms of trade would have to be ¼ plate of pasta per hamburger d.) It is impossible for Bob and Jimmy to mutually benefit from tradearrow_forward
arrow_back_ios
SEE MORE QUESTIONS
arrow_forward_ios
Recommended textbooks for you
 Principles of Economics (12th Edition)EconomicsISBN:9780134078779Author:Karl E. Case, Ray C. Fair, Sharon E. OsterPublisher:PEARSON
 Engineering Economy (17th Edition)EconomicsISBN:9780134870069Author:William G. Sullivan, Elin M. Wicks, C. Patrick KoellingPublisher:PEARSON
 Principles of Economics (MindTap Course List)EconomicsISBN:9781305585126Author:N. Gregory MankiwPublisher:Cengage Learning
 Managerial Economics: A Problem Solving ApproachEconomicsISBN:9781337106665Author:Luke M. Froeb, Brian T. McCann, Michael R. Ward, Mike ShorPublisher:Cengage Learning
 Managerial Economics & Business Strategy (Mcgraw-...EconomicsISBN:9781259290619Author:Michael Baye, Jeff PrincePublisher:McGraw-Hill Education
Principles of Economics (12th Edition)
Economics
ISBN:9780134078779
Author:Karl E. Case, Ray C. Fair, Sharon E. Oster
Publisher:PEARSON
Engineering Economy (17th Edition)
Economics
ISBN:9780134870069
Author:William G. Sullivan, Elin M. Wicks, C. Patrick Koelling
Publisher:PEARSON
Principles of Economics (MindTap Course List)
Economics
ISBN:9781305585126
Author:N. Gregory Mankiw
Publisher:Cengage Learning
Managerial Economics: A Problem Solving Approach
Economics
ISBN:9781337106665
Author:Luke M. Froeb, Brian T. McCann, Michael R. Ward, Mike Shor
Publisher:Cengage Learning
Managerial Economics & Business Strategy (Mcgraw-...
Economics
ISBN:9781259290619
Author:Michael Baye, Jeff Prince
Publisher:McGraw-Hill Education