
ENGR.ECONOMIC ANALYSIS
14th Edition
ISBN: 9780190931919
Author: NEWNAN
Publisher: Oxford University Press
expand_more
expand_more
format_list_bulleted
Related questions
Question
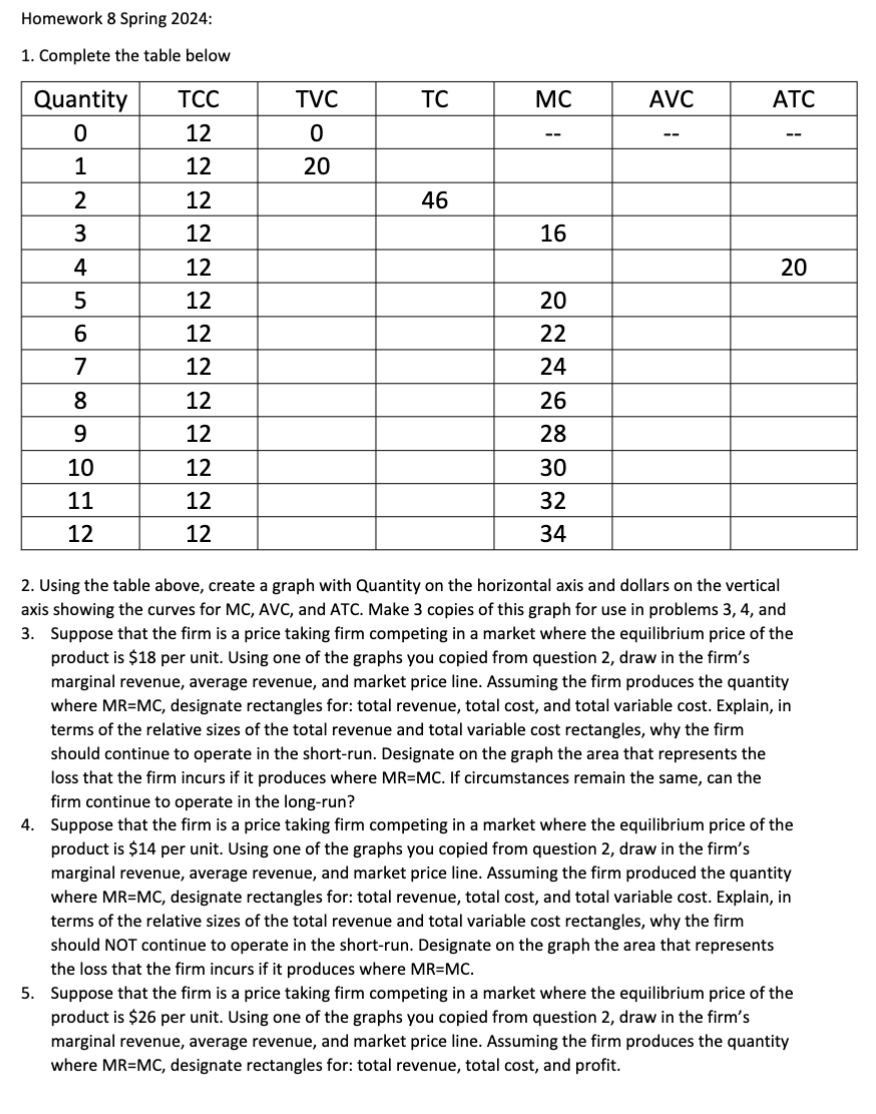

Transcribed Image Text:Homework 8 Spring 2024:
1. Complete the table below
Quantity
TCC
TVC
TC
MC
AVC
ATC
01234561
12
0
--
--
--
12
20
12
12
46
16
12
20
12
20
12
22
7
12
24
8
12
26
9
12
28
10
12
30
11
12
32
12
12
34
2. Using the table above, create a graph with Quantity on the horizontal axis and dollars on the vertical
axis showing the curves for MC, AVC, and ATC. Make 3 copies of this graph for use in problems 3, 4, and
3. Suppose that the firm is a price taking firm competing in a market where the equilibrium price of the
product is $18 per unit. Using one of the graphs you copied from question 2, draw in the firm's
marginal revenue, average revenue, and market price line. Assuming the firm produces the quantity
where MR=MC, designate rectangles for: total revenue, total cost, and total variable cost. Explain, in
terms of the relative sizes of the total revenue and total variable cost rectangles, why the firm
should continue to operate in the short-run. Designate on the graph the area that represents the
loss that the firm incurs if it produces where MR-MC. If circumstances remain the same, can the
firm continue to operate in the long-run?
4. Suppose that the firm is a price taking firm competing in a market where the equilibrium price of the
product is $14 per unit. Using one of the graphs you copied from question 2, draw in the firm's
marginal revenue, average revenue, and market price line. Assuming the firm produced the quantity
where MR=MC, designate rectangles for: total revenue, total cost, and total variable cost. Explain, in
terms of the relative sizes of the total revenue and total variable cost rectangles, why the firm
should NOT continue to operate in the short-run. Designate on the graph the area that represents
the loss that the firm incurs if it produces where MR=MC.
5. Suppose that the firm is a price taking firm competing in a market where the equilibrium price of the
product is $26 per unit. Using one of the graphs you copied from question 2, draw in the firm's
marginal revenue, average revenue, and market price line. Assuming the firm produces the quantity
where MR=MC, designate rectangles for: total revenue, total cost, and profit.
Expert Solution
This question has been solved!
Explore an expertly crafted, step-by-step solution for a thorough understanding of key concepts.

Step by stepSolved in 3 steps with 2 images

Knowledge Booster


Learn more about
Need a deep-dive on the concept behind this application? Look no further. Learn more about this topic, economics and related others by exploring similar questions and additional content below.Similar questions
- homework micro.docx - Word (Error de activación de productos) ARCHIVO INICIO INSERTAR DISEÑO DISEÑO DE PÁGINA CORRESPONDENCIA Diana Arenas - REFERENCIAS REVISAR VISTA X Cortar A Buscar - -|11 - A Calibri (Cuerpo) A Aar A AаBЬСcDd AaBЬСcDd AaBbС AаBbСcС Аав АавЬСсD ab Copiar Sac Reemplazar 1 Normal 1 Sin espa. Título 1 Título 2 Puesto Subtítulo Pegar N K abe X, x² A - aly . A Copiar formato Seleccionar - Portapapeles Fuente Párrafo Estilos Edición 21. Laissez-faire is a policy that espouses central planning. True or false 22. If MU=MC=P, and economist van judge with certainty that the distribution of output is A. Equal B. efficient C. Fair D. Unbiased 23. If arrival and departure delays are frequent early in the morning and late afternoons, but there are no delays during the evening hours, we can conclude that the airport authority A. Charges high landing fees at common departure and arrival times B. Should reduce the number of flights during the busy times C. is concerned about the…arrow_forwardplease read the question carefully as there are multiple questions with the same graphs that is shown on the imagearrow_forwardquestion 11 please.arrow_forward
- 5 IX 3 330 Price 8 7 6 2 1 0 110 220 440 550 660 Quantity per month 770 DS 880 (935, 0.5 990 Tools 1 22 O 52 e Suppose that in December the demand of mandarin oranges increases by 275 while the supply increases by 110. a) Draw the new curves D2 and S2 in graph above. Plot only the endpoints of the curve above and position those points on the edges of the graphing area.arrow_forwardhomework micro.docx - Word (Error de activación de productos) ARCHIVO INICIO INSERTAR DISEÑO DISEÑO DE PÁGINA CORRESPONDENCIA Diana Arenas - REFERENCIAS REVISAR VISTA X Cortar A Buscar - -|11 - A Calibri (Cuerpo) A Aa- A AaBbCcDd AaBbCcDd AaBbC AaBbCcC AABI AaBbCcD ab Copiar Sac Reemplazar 1 Normal 1 Sin espa. Título 1 Título 2 Puesto Subtítulo Pegar N K abe X, x² A - aby - A Copiar formato Seleccionar - Portapapeles Fuente Párrafo Estilos Edición 1. Inefficient allocation of resources occurs when A. society is operating at a point low on the production possibilities frontier B. society is operating at a point high on the production possibilities frontier C. no one can be made better off without having someone else give up something D. it is possible to make some people better off without making others worse off. 2. The marginal revenue curve for a monopolist is always below the demand curve. True or false 3. Under a systems of laissez-faire, output selection is determined by…arrow_forwardRefer to the figure, Price (dollars) 600 550 500 450 400 350 300 250 200 150 100 50 0 Market for Game Consoles S 10 20 30 40 50 60 70 80 90 100110 Quantity Toola DL 0 O Use the graph to show the area representing the deadweight loss, and then determine the deadweight loss created as a result of setting the price at $150. Instructions: Use the tool provided "DL to illustrate this area on the graph. Deadweight loss: $arrow_forward
arrow_back_ios
arrow_forward_ios
Recommended textbooks for you
 Principles of Economics (12th Edition)EconomicsISBN:9780134078779Author:Karl E. Case, Ray C. Fair, Sharon E. OsterPublisher:PEARSON
 Engineering Economy (17th Edition)EconomicsISBN:9780134870069Author:William G. Sullivan, Elin M. Wicks, C. Patrick KoellingPublisher:PEARSON
 Principles of Economics (MindTap Course List)EconomicsISBN:9781305585126Author:N. Gregory MankiwPublisher:Cengage Learning
 Managerial Economics: A Problem Solving ApproachEconomicsISBN:9781337106665Author:Luke M. Froeb, Brian T. McCann, Michael R. Ward, Mike ShorPublisher:Cengage Learning
 Managerial Economics & Business Strategy (Mcgraw-...EconomicsISBN:9781259290619Author:Michael Baye, Jeff PrincePublisher:McGraw-Hill Education
Principles of Economics (12th Edition)
Economics
ISBN:9780134078779
Author:Karl E. Case, Ray C. Fair, Sharon E. Oster
Publisher:PEARSON
Engineering Economy (17th Edition)
Economics
ISBN:9780134870069
Author:William G. Sullivan, Elin M. Wicks, C. Patrick Koelling
Publisher:PEARSON
Principles of Economics (MindTap Course List)
Economics
ISBN:9781305585126
Author:N. Gregory Mankiw
Publisher:Cengage Learning
Managerial Economics: A Problem Solving Approach
Economics
ISBN:9781337106665
Author:Luke M. Froeb, Brian T. McCann, Michael R. Ward, Mike Shor
Publisher:Cengage Learning
Managerial Economics & Business Strategy (Mcgraw-...
Economics
ISBN:9781259290619
Author:Michael Baye, Jeff Prince
Publisher:McGraw-Hill Education