
MATLAB: An Introduction with Applications
6th Edition
ISBN: 9781119256830
Author: Amos Gilat
Publisher: John Wiley & Sons Inc
expand_more
expand_more
format_list_bulleted
Related questions
Question
thumb_up100%
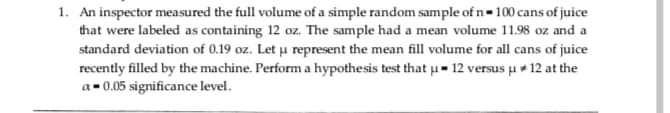

Transcribed Image Text:1. An inspector measured the full volume of a simple random sample of n= 100 cans of juice
that were labeled as containing 12 oz. The sample had a mean volume 11.98 oz and a
standard deviation of 0.19 oz. Let u represent the mean fill volume for all cans of juice
recently filled by the machine. Perform a hypothesis test that u- 12 versus u+ 12 at the
a-0.05 significance level.
Expert Solution
This question has been solved!
Explore an expertly crafted, step-by-step solution for a thorough understanding of key concepts.

Step by stepSolved in 2 steps with 2 images

Knowledge Booster

Similar questions
- A clinical researcher performs a clinical trial on 12 patients to determine whether a drug treatment has an effect on serum glucose. The sample mean glucose of the patients before and after the treatment are summarized in the following table. The sample standard deviation of the differences was 6. Sample mean glucose (mg/dL) Before treatment 114 After treatment 108 What type of hypothesis test should be performed?Select: Left-tailed z-test Unpaired t-test Two-tailed z-test Paired t-test What is the test statistic? What is the number of degrees of freedom? Does sufficient evidence exist to support the claim that the drug treatment has an effect on serum glucose at the α=0.05 significance level? Select: _____Yes OR _____Noarrow_forwardDo campers with trailers really get better mileage per gallon on the highway? The table shows results from a study of the MPG (miles per gallon) of campers with trailers both in the mountains and on desert roads. Assume that the two samples are randomly selected, independent, the population standard deviations are not know and not considered equal. At the 0.05 significance level, test the claim that the mpg on desert roads is better than in the mountains. MPG on Desert Roads 30.9 32.6 28.4 25.4 35.1 32.4 31.1 30.9 34.1 35.5 MPG in the Mountains 24 21.2 22.3 24.9 23.2 24.2 25.1 25.8 23.1 28.1 What are the correct hypotheses? (Select the correct symbols and use decimal values not percentages.) Hg: Select an answer v Select an answer H: Select an answer ? v Select an answer v Original Claim = Select an answer v df =arrow_forwardA researcher wonders whether the recession has changed variability in family size in his city. Before the recession, the mean was 3.7 and the standard deviation was 1.76. The researcher randomly selects 41 families from a population that is normally distributed. His sample has a mean of 3.1 and a standard deviation of 1.45. Test the claim that the standard deviation in size has changed at the αα=.05 significance level.arrow_forward
- Use a 0.05 significance level to test the claim that males and females have the same mean BMI Male BMI n=80 * = 26.3 s = 5.4 Female BMI n=61 I = 28.4 s = 7.4arrow_forward5.37 Dental anxiety study. To gauge their fear of going to a den- tist, a random sample of adults completed the Modified Dental Anxiety Scale questionnaire (BMC Oral Health, Vol. 9, 2009). Scores on the scale range from zero (no anx- iety) to 25 (extreme anxiety). The mean score was 11 and the standard deviation was 4. Assume that the distribution of all scores on the Modified Dental Anxiety Scale is ap- proximately normal with µ = 11 and o = 4. a. Suppose you score a 10 on the Modified Dental Anxiety Scale. Find the z-value for your score. b. Find the probability that someone scores between 10 and 15 on the Modified Dental Anxiety Scale. c. Find the probability that someone scores above 20 on the Modified Dental Anxiety Scale.arrow_forwardThe average "moviegoer" sees 8.5 movies a year. A moviegoer is defined as a person who sees at least one movie in a theater in a 12-month period. A random sample of 42 moviegoers from a large university revealed that the average number of movies seen per person was 9.9. The population standard deviation is 3.2 movies. At the 0.05 level of significance, can it be concluded that this represents a difference from the national average?arrow_forward
- In a random sample of males, it was found that 21 write with their left hands and 210 do not. In a random sample of females, it was found that 56 write with their left hands and 440 do not. Use a 0.05 significance level to test the claim that the rate of left-handedness among males is less than that among females. Identify the test statistic. and p valuearrow_forwardIn a test of the effectiveness of garlic for lowering cholesterol, 4949 subjects were treated with raw garlic. Cholesterol levels were measured before and after the treatment. The changes (before minus after) in their levels of LDL cholesterol (in mg/dL) have a mean of 0.30.3 and a standard deviation of 2.142.14 Use a 0.100.10 significance level to test the claim that with garlic treatment, the mean change in LDL cholesterol is greater than 00. What do the results suggest about the effectiveness of the garlic treatment? Assume that a simple random sample has been selected. Identify the null and alternative hypotheses, test statistic, P-value, and state the final conclusion that addresses the original claim. What are the null and alternative hypotheses? A. Upper H 0H0: muμequals=00 mg/dL Upper H 1H1: muμless than<00 mg/dL B. Upper H 0H0: muμequals=00 mg/dL Upper H 1H1: muμgreater than>00 mg/dL C. Upper H 0H0: muμequals=00 mg/dL Upper…arrow_forwardA random sample of 15 hourly wages for restaurant servers (including tips) was drawn from a normal population. The sample mean and sample standard deviation were $14.9 and $6.75 respectevely.Can we infer at the 5% significance level that the mean wage for restaurant servers (including tips) is greater than 12?arrow_forward
- Suppose IQ scores were obtained for 20 randomly selected sets of couples. The 20 pairs of measurements yield x = 101.02, y = 100.75, r = 0.852, P-value = 0.000, and y = 5.93 + 0.94x, where x represents the IQ score of the husband. Find the best predicted value of y given that the husband has an lQ of 100? Use a significance level of 0.05. %3D Click the icon to view the critical values of the Pearson correlation coefficient r. The best predicted value of y is Critical values of the pearson correlation coefficient r (Round to two decimal places as needed.) Critical Values of the Pearson Correlation Coefficient r X = 0.05 a = 0.01 INOTE: To test Ho: p=0 n Jagainst H,: p+0, reject Ho if the absolute value of r is greater than the critical value in the table. 4 0.950 0.990 0.878 0.959 0.811 0.917 7 0.754 0.875 0.707 0.834 0.666 0.798 10 0.632 0.765 11 0.602 0.735 12 0.576 0.708 13 0.553 0.684 14 0.532 0.661 15 0.514 0.641 16 0.497 0.623 17 0.482 0.606 18 0.468 0.590 19 0.456 0.575 20 0.444…arrow_forwardIn a test of the effectiveness of garlic for lowering cholesterol, 4949 subjects were treated with raw garlic. Cholesterol levels were measured before and after the treatment. The changes (before minus after) in their levels of LDL cholesterol (in mg/dL) have a mean of 0.40.4 and a standard deviation of 23.823.8. Use a 0.010.01 significance level to test the claim that with garlic treatment, the mean change in LDL cholesterol is greater than 00. What do the results suggest about the effectiveness of the garlic treatment? Assume that a simple random sample has been selected. Identify the null and alternative hypotheses, test statistic, P-value, and state the final conclusion that addresses the original claim. Determine the test statistic. nothing (Round to two decimal places as needed.)arrow_forwardData on the weights (lb) of the contents of cans of diet soda versus the contents of cans of the regular version of the soda is summarized to the right. Assume that the two samples are independent simple random samples selected from normally distributed populations, and do not assume that the population standard deviations are equal. Complete parts (a) and (b) below. Use a 0.05 significance level for both parts. a. Test the claim that the contents of cans of diet soda have weights with a mean that is less than the mean for the regular soda. What are the null and alternative hypotheses? OA. Ho: H₁ H₂ H₁: H₁ H₂ O C. Ho: H#2 H₁ H₁arrow_forward
arrow_back_ios
SEE MORE QUESTIONS
arrow_forward_ios
Recommended textbooks for you
- MATLAB: An Introduction with ApplicationsStatisticsISBN:9781119256830Author:Amos GilatPublisher:John Wiley & Sons Inc
 Probability and Statistics for Engineering and th...StatisticsISBN:9781305251809Author:Jay L. DevorePublisher:Cengage Learning
 Statistics for The Behavioral Sciences (MindTap C...StatisticsISBN:9781305504912Author:Frederick J Gravetter, Larry B. WallnauPublisher:Cengage Learning
  Elementary Statistics: Picturing the World (7th E...StatisticsISBN:9780134683416Author:Ron Larson, Betsy FarberPublisher:PEARSON
 The Basic Practice of StatisticsStatisticsISBN:9781319042578Author:David S. Moore, William I. Notz, Michael A. FlignerPublisher:W. H. Freeman
 Introduction to the Practice of StatisticsStatisticsISBN:9781319013387Author:David S. Moore, George P. McCabe, Bruce A. CraigPublisher:W. H. Freeman
MATLAB: An Introduction with Applications
Statistics
ISBN:9781119256830
Author:Amos Gilat
Publisher:John Wiley & Sons Inc
Probability and Statistics for Engineering and th...
Statistics
ISBN:9781305251809
Author:Jay L. Devore
Publisher:Cengage Learning
Statistics for The Behavioral Sciences (MindTap C...
Statistics
ISBN:9781305504912
Author:Frederick J Gravetter, Larry B. Wallnau
Publisher:Cengage Learning
Elementary Statistics: Picturing the World (7th E...
Statistics
ISBN:9780134683416
Author:Ron Larson, Betsy Farber
Publisher:PEARSON
The Basic Practice of Statistics
Statistics
ISBN:9781319042578
Author:David S. Moore, William I. Notz, Michael A. Fligner
Publisher:W. H. Freeman
Introduction to the Practice of Statistics
Statistics
ISBN:9781319013387
Author:David S. Moore, George P. McCabe, Bruce A. Craig
Publisher:W. H. Freeman