MATLAB: An Introduction with Applications
6th Edition
ISBN: 9781119256830
Author: Amos Gilat
Publisher: John Wiley & Sons Inc
expand_more
expand_more
format_list_bulleted
Question

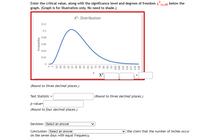
Transcribed Image Text:Enter the critical value, along with the significance level and degrees of freedom x?(a,dn below the
graph. (Graph is for illustration only. No need to shade.)
X²- Distribution
0.12
0.1
0.08
0.06
0.04
0.02
X2
(Round to three decimal places.)
Test Statistic =
(Round to three decimal places.)
p-value-
(Round to four decimal places.)
Decision: Select an answer
Conclusion: Select an answer
on the seven days with equal frequency.
v the claim that the number of inches occur
Probability
103
60T
115
121
127
133

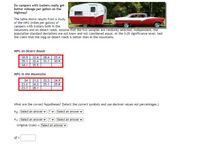
Transcribed Image Text:Do campers with trailers really get
better mileage per gallon on the
highway?
The table shows results from a study
of the MPG (miles per gallon) of
campers with trailers both in the
mountains and on desert roads. Assume that the two samples are randomly selected, independent, the
population standard deviations are not know and not considered equal. At the 0.05 significance level, test
the claim that the mpg on desert roads is better than in the mountains.
MPG on Desert Roads
30.9
32.6
28.4
25.4
35.1
32.4
31.1
30.9
34.1
35.5
MPG in the Mountains
24
21.2
22.3
24.9
23.2
24.2
25.1
25.8
23.1
28.1
What are the correct hypotheses? (Select the correct symbols and use decimal values not percentages.)
Hg: Select an answer v
Select an answer
H: Select an answer
? v Select an answer v
Original Claim = Select an answer v
df =
Expert Solution
This question has been solved!
Explore an expertly crafted, step-by-step solution for a thorough understanding of key concepts.
This is a popular solution
Trending nowThis is a popular solution!
Step by stepSolved in 3 steps

Knowledge Booster
Learn more about
Need a deep-dive on the concept behind this application? Look no further. Learn more about this topic, statistics and related others by exploring similar questions and additional content below.Similar questions
- The weight and systolic blood pressure of 26 randomly selected males in the age group 25 – 30 are shown below. Assume that weight and blood pressure (BP) are jointly normally distributed. a. Find a regression line relating systolic blood pressure to weight. b. Estimate the correlation coefficient. c. Test the significance of the regression coefficient (Use the Variance Analysis Table) d. Work in two ways using manuals and statistical applications (analyze the results of both)arrow_forwardWhat conditions are necessary in order to use the dependent samples t-test for the mean of the difference of two populations?arrow_forwardSay we were testing the effects of taking calcium on bone density levels and obtained a positive and significant value for our independent t test result. What would you write (using APA format) when performing a percentage of variance explained test on the data and received a value of r2=.38.arrow_forward
- Astudy was done on body temperatures of men and women. The results are shown in the table. Assume that the two samples are independent simple random samples selected from normally distributed populations, and do not assume that the population standard deviations are equal. Complete parts (a) and (b) below. Use a 0.05 significance level for both parts.arrow_forwardListed below are systolic blood pressure measurements (mm Hg) taken from the right and left arms of the same woman. Assume that the paired sample data is a simple random sample and that the differences have a distribution that is approximately normal. Use a 0.10 significance level to test for a difference between the measurements from the two arms. What can be concluded? Right arm 142 132 127 137 130 D Left arm 174 172 184 137 147 O A. Ho: Hd =0 B. Ho: Ha 0 H1: Hd =0 %3D OC. Ho: Hd = 0 H1: Hd 0 Identify the test statistic. (Round to two decimal places as needed.) t= Identify the P-value. P-value = (Round to three decimal places as needed.) What is the conclusion based on the hypothesis test?arrow_forwardplease don't provide hand writtin solution....arrow_forward
- Image has all the dataarrow_forwardA researcher wants to know if there is a difference between the mean amount of sleep that people get for various types of employment status. The table below shows data that was collected from a survey. Full Time Worker Part Time Worker Unemployed 8 9 9 6 6 8 7 8 10 8 9 10 7 7 9 7 9 9 8 7 7 Assume that all distributions are normal, the three population standard deviations are all the same, and the data was collected independently and randomly. Use a level of significance of α=0.01α=0.01.H0: μ1=μ2=μ3H0: μ1=μ2=μ3H1:H1: At least two of the means differ from each other. For this study, we should use The test-statistic for this data = (Please show your answer to 3 decimal places.) The p-value for this sample = (Please show your answer to 4 decimal places.) The p-value is αα Base on this, we should hypothesis As such, the final conclusion is that... There is sufficient evidence to support the claim that employment status is a factor in the…arrow_forwardWhen you are testing the difference between two means, it is not important to distinguish whether the samples are independent of each other. Truearrow_forward
- Getting an adequate amount of sleep can improve a variety of physiological functions, and it is known that the average number of hours that people sleep each night is normally distributed. A psychiatrist or a major research center takes an SRS of 25 emotionally disturbed patients and records the average amount of sleep that each gets on a typical night. He summarizes the data and finds that Xbar=6.90 and S= 0.878. What sample size would the researcher need to use in order to decrease the margin of error of a 95% confidence interval to +-0.20 hours?arrow_forwardListed below are systolic blood pressure measurements (mm Hg) taken from the right and left arms of the same woman. Assume that the paired sample data is a simple random sample and that the differences have a distribution that is approximately normal. Use a 0.05 significance level to test for a difference between the measurements from the two arms. What can be concluded? Right arm Left arm 151 136 120 134 134 181 174 180 156 138 In this example, Ha is the mean value of the differences d for the population of all pairs of data, where each individual difference d is defined as the measurement from the right arm minus the measurement from the left arm. What are the null and alternative hypotheses for the hypothesis test? O A. Ho: Hd = 0 O B. Ho: Hd 0 O C. Ho: Hd = 0 O D. Ho: Hd 0 H1: Ha>0arrow_forwardListed below are systolic blood pressure measurements (mm Hg) taken from the right and left arms of the same woman. Assume that the paired sample data is a simple random sample and that the differences have a distribution that is approximately normal. Use a 0.01 significance level to test for a difference between the measurements from the two arms. Identify the test statistic and p-value. A. T = -4.01, p-value = 0.016 B. T = -3.07, p-value = 0.037 C. T = -2.32, p-value = 0.081 D. T = -1.93, p-value = 0.127arrow_forward
arrow_back_ios
arrow_forward_ios
Recommended textbooks for you
 MATLAB: An Introduction with ApplicationsStatisticsISBN:9781119256830Author:Amos GilatPublisher:John Wiley & Sons Inc
 Probability and Statistics for Engineering and th...StatisticsISBN:9781305251809Author:Jay L. DevorePublisher:Cengage Learning
 Statistics for The Behavioral Sciences (MindTap C...StatisticsISBN:9781305504912Author:Frederick J Gravetter, Larry B. WallnauPublisher:Cengage Learning
 Elementary Statistics: Picturing the World (7th E...StatisticsISBN:9780134683416Author:Ron Larson, Betsy FarberPublisher:PEARSON
 The Basic Practice of StatisticsStatisticsISBN:9781319042578Author:David S. Moore, William I. Notz, Michael A. FlignerPublisher:W. H. Freeman
 Introduction to the Practice of StatisticsStatisticsISBN:9781319013387Author:David S. Moore, George P. McCabe, Bruce A. CraigPublisher:W. H. Freeman

MATLAB: An Introduction with Applications
Statistics
ISBN:9781119256830
Author:Amos Gilat
Publisher:John Wiley & Sons Inc

Probability and Statistics for Engineering and th...
Statistics
ISBN:9781305251809
Author:Jay L. Devore
Publisher:Cengage Learning

Statistics for The Behavioral Sciences (MindTap C...
Statistics
ISBN:9781305504912
Author:Frederick J Gravetter, Larry B. Wallnau
Publisher:Cengage Learning

Elementary Statistics: Picturing the World (7th E...
Statistics
ISBN:9780134683416
Author:Ron Larson, Betsy Farber
Publisher:PEARSON

The Basic Practice of Statistics
Statistics
ISBN:9781319042578
Author:David S. Moore, William I. Notz, Michael A. Fligner
Publisher:W. H. Freeman

Introduction to the Practice of Statistics
Statistics
ISBN:9781319013387
Author:David S. Moore, George P. McCabe, Bruce A. Craig
Publisher:W. H. Freeman