
MATLAB: An Introduction with Applications
6th Edition
ISBN: 9781119256830
Author: Amos Gilat
Publisher: John Wiley & Sons Inc
expand_more
expand_more
format_list_bulleted
Related questions
Topic Video
Question

Transcribed Image Text:Uin a grouped
irequency distribution table of this data.
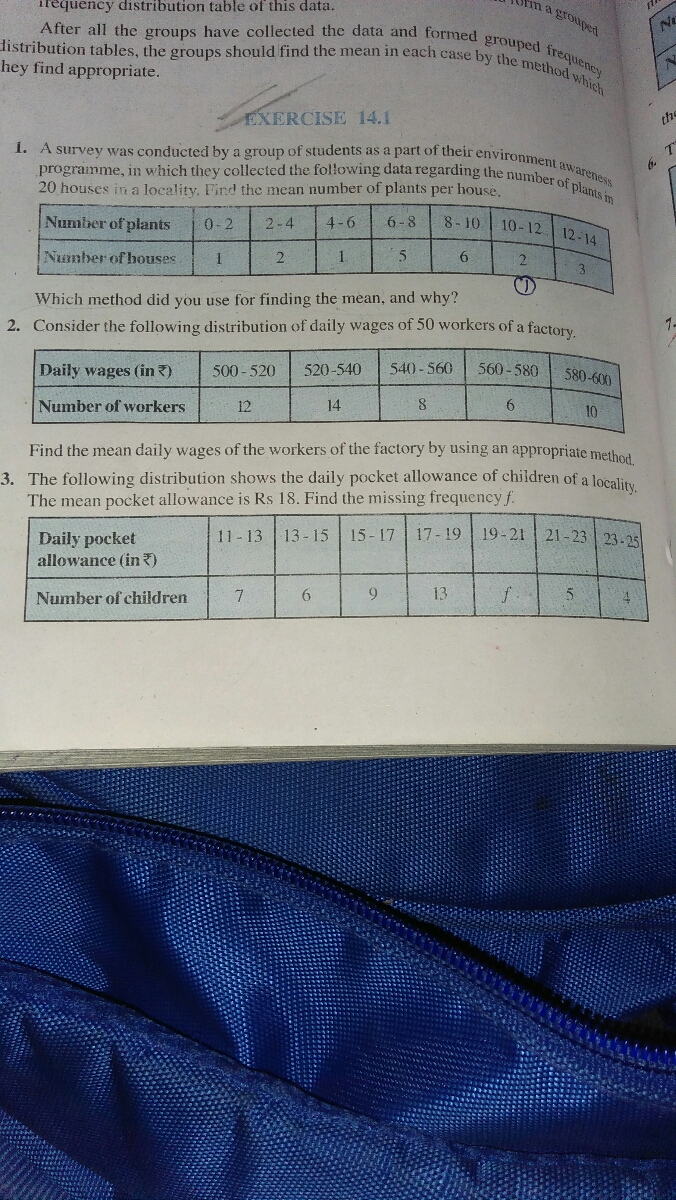
programme, in which they collected the following data regarding the number of plants in
1. A survey was conducted by a group of students as a part of their environment awareness
listribution tables, the groups should find the mean in each case by the method which
After all the groups have collected the data and formed grouped frequency
NC
hey find appropriate.
EXERCISE 14.1
the
20 houses in a locality. Find the mean number of plants per house.
Number of plants
8- 10| 10-12.| 12-14
0-2
2-4
4-6
6-8
Number of houses
21
1.
6
2.
3
Which method did you use for finding the mean, and why?
2. Consider the following distribution of daily wages of 50 workers of a factory
Daily wages (in 7)
500 - 520
520-540
540- 560
560- 580
580-600
Number of workers
12
14
8.
6.
10
Find the mean daily wages of the workers of the factory by using an appropriate method
3. The following distribution shows the daily pocket allowance of children of a localio,
The mean pocket allowance is Rs 18. Find the missing frequency f.
17-19
19-21 21-23 23-25
11-13
13-15 15-17
Daily pocket
allowance (in 7)
Number of children
7
6.
9
13
Expert Solution
This question has been solved!
Explore an expertly crafted, step-by-step solution for a thorough understanding of key concepts.

This is a popular solution

Trending nowThis is a popular solution!

Step by stepSolved in 3 steps

Knowledge Booster


Learn more about
Need a deep-dive on the concept behind this application? Look no further. Learn more about this topic, statistics and related others by exploring similar questions and additional content below.Similar questions
- I need help with something regarding this problem. The National Sleep Foundation recommends that adults aged 18 to 64 get an average of 8 hours of sleep per night. A survey of sleep hours was taken during a Statistics class. The data is listed below: 4, 5, 5, 5, 5.5, 6, 6, 6, 6, 7, 7, 7, 7, 7, 7, 7, 8, 8, 8, 8, 9, 9, 9, 10, 10 Do we have enough evidence at the 0.05 significance level to say that statistics students tend to get less sleep than the recommended average of 8 hours per night? How would I get the degrees of freedom?arrow_forwardA psychologist has designed an index to measure the social perspectives of elementary school children. The index is based on ratings of a child’s responses to questions about a set of photographs showing different social situations. The following are the indices measured on a random sample of 16 children attending elementary school in a particular district. 48, 75, 69, 58, 60, 68, 59, 66, 71, 52, 49, 60, 54, 55, 70, 57 For the data the mean index is 60.69 and the standard deviation is 8.26. The confidence interval is 95%, with a level of significance of 0.05. Perform a statistical test to determine if the population mean index is greater than 50. a) Name of hypothesis test: b) H0: c) HA: d) Test Statistic: e) Rejection region: f) Decision in the context of the problem:arrow_forwardA random sample of 25 Berkeley College students was asked, “How many hours per week typically do you work outside the home?” Their responses were as follows: {0, 0, 15, 20, 30, 40, 30, 20, 35, 35, 28, 15, 20, 25, 25, 30, 5, 10, 30, 24, 28, 30, 35, 15, 15} a. Find the mean, the median and the mode of hours worked outside the home for the sample data. Show all your work to justify your answer. b. Use the above data to complete the following table summarizing the number of hours worked outside the home. Express the relative frequency as a percent. Class Tally Frequency Relative Frequency 0-10 11-20 21-30 31-40 Total c. Find the five-number summary of the hours worked outside of the home by the 25 Berkeley College students.arrow_forward
- Cris Turlock owns and manages a small business in San Francisco, California. The business provides breakfast and brunch food, via carts parked along sidewalks, to people in the business district of the city. Being an experienced businessperson, Cris provides incentives for the four salespeople operating the food carts. This year, she plans to offer monetary bonuses to her salespeople based on their individual mean daily sales. Below is a chart giving a summary of the information that Cris has to work with. (A "sample" is a collection of daily sales figures, in dollars, from this past year for a particular salesperson.) Groups Sample size Sample mean Sample variance Salesperson 1 143 204.8 2382.8 Salesperson 2 97 209.9 2501.3 Salesperson 3 53 218.3 2461.6 Salesperson 4 95 205.8 2373.9arrow_forwardQ2. The 30% trimmed mean of the following data (120, 150, 170, 177, 178, 181, 198, 250, 450, 955} is: *arrow_forwardIn a city with three high schools, all the ninth graders took a Standardized Test, with these results: High School Mean Test Score Number of ninth graders (Frequency) Glenwood 79 279 Central 94 349 Lincoln 70 161 The city's PR manager, who never took statistics, claimed the mean score of all ninth graders in the city was the average of 79, 94, and 70, which is 81. Of course, that is incorrect. What is the mean score for all ninth graders in the city? Round to one decimal place. Mean of all ninth grader's Scores =arrow_forward
- Some Woodside customers were asked the age of their houses. The table summarizes the results. Age of Home Number of Midpoint (years) Customers 0-8 17 9-17 10 18 26 27 35 4. What are the mean and median of the age of houses? O mean 14 and median 13 O mean 12 and median 22 O mean 13 and median 13 O mean 12 and median 13arrow_forwardDetermine what the key terms refer to in the following study. We want to know the average (mean) amount of money first year college students spend at ABC College on school supplies that do not include books. We randomly surveyed 100 first year students at the college. Three of those students spent $150, $200, and $225, respectively.arrow_forward
arrow_back_ios
arrow_forward_ios
Recommended textbooks for you
- MATLAB: An Introduction with ApplicationsStatisticsISBN:9781119256830Author:Amos GilatPublisher:John Wiley & Sons Inc
 Probability and Statistics for Engineering and th...StatisticsISBN:9781305251809Author:Jay L. DevorePublisher:Cengage Learning
 Statistics for The Behavioral Sciences (MindTap C...StatisticsISBN:9781305504912Author:Frederick J Gravetter, Larry B. WallnauPublisher:Cengage Learning
  Elementary Statistics: Picturing the World (7th E...StatisticsISBN:9780134683416Author:Ron Larson, Betsy FarberPublisher:PEARSON
 The Basic Practice of StatisticsStatisticsISBN:9781319042578Author:David S. Moore, William I. Notz, Michael A. FlignerPublisher:W. H. Freeman
 Introduction to the Practice of StatisticsStatisticsISBN:9781319013387Author:David S. Moore, George P. McCabe, Bruce A. CraigPublisher:W. H. Freeman
MATLAB: An Introduction with Applications
Statistics
ISBN:9781119256830
Author:Amos Gilat
Publisher:John Wiley & Sons Inc
Probability and Statistics for Engineering and th...
Statistics
ISBN:9781305251809
Author:Jay L. Devore
Publisher:Cengage Learning
Statistics for The Behavioral Sciences (MindTap C...
Statistics
ISBN:9781305504912
Author:Frederick J Gravetter, Larry B. Wallnau
Publisher:Cengage Learning
Elementary Statistics: Picturing the World (7th E...
Statistics
ISBN:9780134683416
Author:Ron Larson, Betsy Farber
Publisher:PEARSON
The Basic Practice of Statistics
Statistics
ISBN:9781319042578
Author:David S. Moore, William I. Notz, Michael A. Fligner
Publisher:W. H. Freeman
Introduction to the Practice of Statistics
Statistics
ISBN:9781319013387
Author:David S. Moore, George P. McCabe, Bruce A. Craig
Publisher:W. H. Freeman