
MATLAB: An Introduction with Applications
6th Edition
ISBN: 9781119256830
Author: Amos Gilat
Publisher: John Wiley & Sons Inc
expand_more
expand_more
format_list_bulleted
Related questions
Question
I'm very confused on e, can you please do it step by step. I would like to know what formulas to use.
For F, I got an interval between 1 and 9 (rounded) but I'm not sure if that is correct.
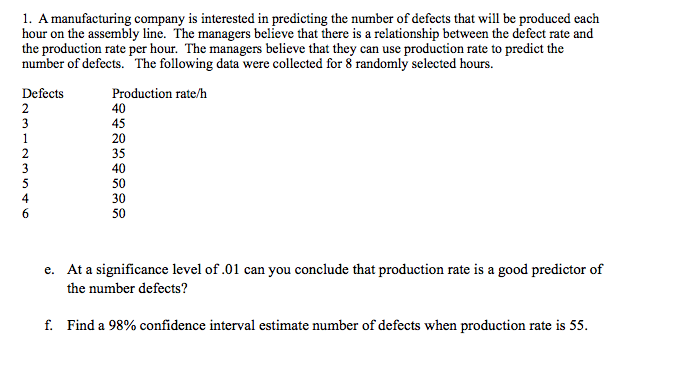

Transcribed Image Text:1. A manufacturing company is interested in predicting the number of defects that will be produced each
hour on the assembly line. The managers believe that there is a relationship between the defect rate and
the production rate per hour. The managers believe that they can use production rate to predict the
number of defects. The following data were collected for 8 randomly selected hours.
Defects
2
3
1
Production rate/h
40
45
20
35
40
50
30
50
3
5
4
e. At a significance level of .01 can you conclude that production rate is a good predictor of
the number defects?
f. Find a 98% confidence interval estimate number of defects when production rate is 55.
Expert Solution
This question has been solved!
Explore an expertly crafted, step-by-step solution for a thorough understanding of key concepts.

This is a popular solution

Trending nowThis is a popular solution!

Step by stepSolved in 2 steps

Knowledge Booster

Similar questions
- I would like to know if I can use the numeric solver function on the calculator to double check my works afterwards. I havent quite figured out how to do that on a TI-84 calculator. For instance for this problem the final answer I got is -92=x. How can I use my TI-84 to double check my work and solve for x.arrow_forwardwhere does t come from?? Is that just the value of "x" in this situation or is it t=thousands?arrow_forwardI need to graph Y=-4/x I'm not understanding how to decide what imputs to use for x. Where does this imput come from and how to determine what to use?arrow_forward
- Can you please help me for this exercise and write the steps for me and circle the answer so that I can understand. That I can solve other exercises like this one. Please note that in the last step, which is e, we must write down the final answer that I asked the question yesterday and you did not write down that I found it.arrow_forwardGiven f (9) - 2. f' (9) - 9. g (9) = -1, and g(9) - 7, find the values of the following. (a) (b) (fg)' (9) Number (4)'9) Numberarrow_forward
arrow_back_ios
arrow_forward_ios
Recommended textbooks for you
- MATLAB: An Introduction with ApplicationsStatisticsISBN:9781119256830Author:Amos GilatPublisher:John Wiley & Sons Inc
 Probability and Statistics for Engineering and th...StatisticsISBN:9781305251809Author:Jay L. DevorePublisher:Cengage Learning
 Statistics for The Behavioral Sciences (MindTap C...StatisticsISBN:9781305504912Author:Frederick J Gravetter, Larry B. WallnauPublisher:Cengage Learning
  Elementary Statistics: Picturing the World (7th E...StatisticsISBN:9780134683416Author:Ron Larson, Betsy FarberPublisher:PEARSON
 The Basic Practice of StatisticsStatisticsISBN:9781319042578Author:David S. Moore, William I. Notz, Michael A. FlignerPublisher:W. H. Freeman
 Introduction to the Practice of StatisticsStatisticsISBN:9781319013387Author:David S. Moore, George P. McCabe, Bruce A. CraigPublisher:W. H. Freeman
MATLAB: An Introduction with Applications
Statistics
ISBN:9781119256830
Author:Amos Gilat
Publisher:John Wiley & Sons Inc
Probability and Statistics for Engineering and th...
Statistics
ISBN:9781305251809
Author:Jay L. Devore
Publisher:Cengage Learning
Statistics for The Behavioral Sciences (MindTap C...
Statistics
ISBN:9781305504912
Author:Frederick J Gravetter, Larry B. Wallnau
Publisher:Cengage Learning
Elementary Statistics: Picturing the World (7th E...
Statistics
ISBN:9780134683416
Author:Ron Larson, Betsy Farber
Publisher:PEARSON
The Basic Practice of Statistics
Statistics
ISBN:9781319042578
Author:David S. Moore, William I. Notz, Michael A. Fligner
Publisher:W. H. Freeman
Introduction to the Practice of Statistics
Statistics
ISBN:9781319013387
Author:David S. Moore, George P. McCabe, Bruce A. Craig
Publisher:W. H. Freeman