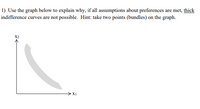

The indifference curve of the consumer shows all the different combinations of two goods that provide the same level of total utility or satisfaction to the consumer. Total utility refers to the total amount of satisfaction received by the consumer from the consumption of a given amount of two commodities.
The slope of the indifference curve shows the rate at which the consumer is willing to substitute the consumption of one good in place of one another so that his total utility remains constant. The slope of the indifference curve is equal to the ratio of the marginal utilities of the two goods the consumer is consuming. The marginal utility of a good is defined as the extra utility the consumer is able to receive by consuming one more unit of a good.
Step by stepSolved in 2 steps with 1 images

- Xia's utility function is U = TC, where T is baskets of tomatoes and C is bags of carrots. One of Xia's indifference curves will go through points: Baskets of 10 tomatoes 9 8 7 6 5 4 3 2 1 0 a. B, C, and F. O b. B, D, and E. O c. A, D, and E. O d. A, B, and F. A D B C F E 123 4 5 6 7 8 9 10 Bags of carrotsarrow_forwardConsider a local department store which only sells jeans (J) and sweaters (S). Jeans cost $30and sweaters cost $15. For each of the examples below, graph the budget constraint our consumer faces, putting J on the horizontal axis and S on the vertical one. Be sure to label our consumer’s initial bundle(what he comes into the store with). a) The consumer comes into the store with 20 sweaters to exchange (and a gift receipt!). b) The consumer comes into the store with 20 sweaters to exchange (and a gift receipt!). There is a 50% restocking fee. c)The consumer comes into the store with 10 jeans and 10 sweaters to exchange (and a gift receipt!). There is a 50% restocking fee on jeans only. Note:- Do not provide handwritten solution. Maintain accuracy and quality in your answer. Take care of plagiarism. Answer completely. You will get up vote for sure.arrow_forward1. In a simple but delicious world, Joey eats only sandwiches, s, and jam, j. He has a Cobb-Douglas utility function U(j, s) = Nj1-asª, where 0 0. The price of jam is pj, the price of sandwiches is Ps, and Joey has a monthly budget Y to spend on lunch. a. Explain why you can safely use a simpler Cobb-Douglas utility function, V(j, s), to represent Joey's preferences, which is the same as U(j, s) except for replacing N with 1. b. Transform V(j,s) by taking natural logs and bringing down exponents. Explain why it is useful to do this for a Cobb-Douglas utility function, but not for a quasi-linear utility function. Use In(V(j, s)) and the substitution method to derive the formulas for Joey's optimal amount of jam, j*, and sandwiches, s*, to buy and consume per month. Simplify your answers so that you arrive at the С. (1-a)Y aY formulas j* = and s* Ps d. What fraction of his income does Joey spend on jam, and what fraction on sandwiches?arrow_forward
- 1. Jim's preferences for pears and apples can be summarized by the following utility function: U(Xa,Xp)=XaXp where xa is the quantity of apples and xp is the quantity of pears. a) Draw an indifference curve for Jim by calculating a series of bundles that all produce the same level of "utility" and plotting them. Interpret the slope of the indifference curve (the marginal rate of substitution). b) Calculate the formula for Jim's marginal rate of substitution, as a function of apples and pears consumed.¹ c) What happens to the numeric value of Jim's marginal rate of substitution along an indifference curve (i.e., holds his utility constant) as he increases the number of pears he consumes and decreases the number of apples? For example, compare his MRS for a bundle consisting of 9 apples and 4 pears to his MRS for a bundle consisting of 9 pears and 4 apples and interpret the change. d) Suppose something increases Jim's desire for apples (for example, apples are found to reduce the risk of…arrow_forwardWhat happens to utility when we move up and down on the indifference curve? What happens to utility when we move up across the indifference map?arrow_forwardSuppose you have a $20 gift card and want to buy Blue and Red yarn. The utility function from yards of blue (B) and red (R) yarn can be expressed as follows: U(B,R) = 3B+R Red yarn costs $4 per yard. blue yarn costs $4 per yard. A) Graph the budget constraint and the indifference curves that can be reached. How many yards of each type of yarn will he purchase at these prices with his gift card?arrow_forward

 Principles of Economics (12th Edition)EconomicsISBN:9780134078779Author:Karl E. Case, Ray C. Fair, Sharon E. OsterPublisher:PEARSON
 Engineering Economy (17th Edition)EconomicsISBN:9780134870069Author:William G. Sullivan, Elin M. Wicks, C. Patrick KoellingPublisher:PEARSON
 Principles of Economics (MindTap Course List)EconomicsISBN:9781305585126Author:N. Gregory MankiwPublisher:Cengage Learning
 Managerial Economics: A Problem Solving ApproachEconomicsISBN:9781337106665Author:Luke M. Froeb, Brian T. McCann, Michael R. Ward, Mike ShorPublisher:Cengage Learning
 Managerial Economics & Business Strategy (Mcgraw-...EconomicsISBN:9781259290619Author:Michael Baye, Jeff PrincePublisher:McGraw-Hill Education


