MATLAB: An Introduction with Applications
6th Edition
ISBN: 9781119256830
Author: Amos Gilat
Publisher: John Wiley & Sons Inc
expand_more
expand_more
format_list_bulleted
Question
Please answer a,b,c

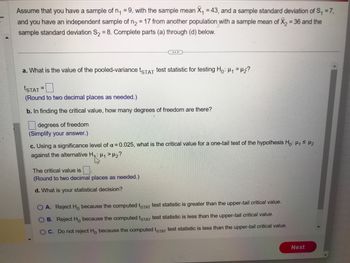
Transcribed Image Text:Assume that you have a sample of n₁ =9, with the sample mean X₁ = 43, and a sample standard deviation of S₁ = 7,
and you have an independent sample of n₂ = 17 from another population with a sample mean of X₂ = 36 and the
sample standard deviation S₂ = 8. Complete parts (a) through (d) below.
a. What is the value of the pooled-variance tSTAT test statistic for testing Ho: H₁ H₂?
ISTAT
(Round to two decimal places as needed.)
b. In finding the critical value, how many degrees of freedom are there?
degrees of freedom
(Simplify your answer.)
=
c. Using a significance level of α = 0.025, what is the critical value for a one-tail test of the hypothesis Ho: H₁ ≤ 1₂
against the alternative H₁: ₁ > H₂?
"13"
The critical value is.
(Round to two decimal places as needed.)
d. What is your statistical decision?
O A. Reject Ho because the computed tSTAT test statistic is greater than the upper-tail critical value.
OB. Reject Ho because the computed tSTAT test statistic is less than the upper-tail critical value.
OC. Do not reject Ho because the computed tSTAT test statistic is less than the upper-tail critical value.
Next
Expert Solution
arrow_forward
Step 1
From the given information we have
Sample mean (x̅1) = 43
Sample mean (x̅2) = 36
Sample size (n1) = 9
Sample size (n2) = 17
Standard deviations (s1) = 7
Standard deviations (s2) = 8
Significance level (α) = 0.01
Step by stepSolved in 2 steps with 1 images

Knowledge Booster
Similar questions
Recommended textbooks for you
 MATLAB: An Introduction with ApplicationsStatisticsISBN:9781119256830Author:Amos GilatPublisher:John Wiley & Sons Inc
 Probability and Statistics for Engineering and th...StatisticsISBN:9781305251809Author:Jay L. DevorePublisher:Cengage Learning
 Statistics for The Behavioral Sciences (MindTap C...StatisticsISBN:9781305504912Author:Frederick J Gravetter, Larry B. WallnauPublisher:Cengage Learning
 Elementary Statistics: Picturing the World (7th E...StatisticsISBN:9780134683416Author:Ron Larson, Betsy FarberPublisher:PEARSON
 The Basic Practice of StatisticsStatisticsISBN:9781319042578Author:David S. Moore, William I. Notz, Michael A. FlignerPublisher:W. H. Freeman
 Introduction to the Practice of StatisticsStatisticsISBN:9781319013387Author:David S. Moore, George P. McCabe, Bruce A. CraigPublisher:W. H. Freeman

MATLAB: An Introduction with Applications
Statistics
ISBN:9781119256830
Author:Amos Gilat
Publisher:John Wiley & Sons Inc

Probability and Statistics for Engineering and th...
Statistics
ISBN:9781305251809
Author:Jay L. Devore
Publisher:Cengage Learning

Statistics for The Behavioral Sciences (MindTap C...
Statistics
ISBN:9781305504912
Author:Frederick J Gravetter, Larry B. Wallnau
Publisher:Cengage Learning

Elementary Statistics: Picturing the World (7th E...
Statistics
ISBN:9780134683416
Author:Ron Larson, Betsy Farber
Publisher:PEARSON

The Basic Practice of Statistics
Statistics
ISBN:9781319042578
Author:David S. Moore, William I. Notz, Michael A. Fligner
Publisher:W. H. Freeman

Introduction to the Practice of Statistics
Statistics
ISBN:9781319013387
Author:David S. Moore, George P. McCabe, Bruce A. Craig
Publisher:W. H. Freeman