Question

Transcribed Image Text:1
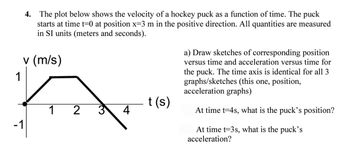
4. The plot below shows the velocity of a hockey puck as a function of time. The puck
starts at time t=0 at position x-3 m in the positive direction. All quantities are measured
in SI units (meters and seconds).
v (m/s)
-1
1 2
4
t(s)
a) Draw sketches of corresponding position
versus time and acceleration versus time for
the puck. The time axis is identical for all 3
graphs/sketches (this one, position,
acceleration graphs)
At time t-4s, what is the puck's position?
At time t-3s, what is the puck's
acceleration?
Expert Solution
arrow_forward
Introduction:
We are given velocity versus time graph. We draw position vs time and acceleration vs time graph by studying the above graph. The velocity in the graph is either increasing or decreasing linearly or is constant. We then can find the position and accelerations in given time. We know that when velocity is constant there is no acceleration acting.
Step by stepSolved in 2 steps with 2 images

Knowledge Booster
Similar questions
- Calculating Displacement- 1. A woman walking her dog travels 200 m north, then 400 m west, then 500 m south. (a). What was the total distance she travelled? (b) What was the magnitude of her displacement for the entire trip?arrow_forwardPlease answer the following question(s): 1. The speed of a boat in still water is vá. A river flows with a speed of v₁. The boat travels distance of 19 miles downstream in a river in 1 hour. However, the return journey takes 2 hours. Calculate the vand v₁. Hint: Velocity=displacement/time. Displacement can be positive of neagtive depending on the direction. You will first need to set up the equations by taking into account the resultant velocity of the boat in flowing water. Consider the direction the river is flowing to be positive. Set up two equations, one for the downstream journey and one for the upstream journey, in terms of "v" and "v": Do v" and "v, add or substract downstream to give the resultant downstream velocity? Do v" and "v, add or substract upstream togive the resultant upstream velocity? Use the upstream direction as negative. The resultant upstream velocity should be negative. vb vb Downstream positive Vr Upstream negative Vrarrow_forwardPls help ASAParrow_forward
- Please answer all the partsarrow_forwardSOLVE STEP BY STEP IN DIGITAL FORMAT 14. If the speed in (m/s) that a certain athlete reaches in a 200-meter race is described by the function v(x) =-0.005x(x - 300), where x is the recommended distance. a) What distance has the athlete traveled when he reaches his maximum speed?b) What is the maximum speed he reaches?arrow_forwardTutorial Exercise A soccer ball is kicked from 2 feet above the ground. The height, h, in feet of the ball after t seconds is given by the function h = -16t2 + 64t + 2. (a) Graph the function. (b) At what time(s) is the height of the ball 50 feet? Step 1 Create a table of values for the function. [AlgUns.0386] The height function is h = -16t2 + 64t + 2. Create a table of values for the ordered pairs of the form (t, h). th = -16t² + 64t + 2 %3D 1 2 4 Submit Skip (you cannot come back)arrow_forward
- D = (oxt) + (1/2 * 8.93* (4.7)2) I D = 98.63 meter 5. You are about to skateboard down a long hill. Your initial velocity is 2.0 m/s south. When you reach the bottom of the hill you are travelling 6.0 m/s south. It took you 57 seconds to reach the bottom of the hill. What was your displacement?arrow_forwardPls help ASAParrow_forward3. A tennis ball is thrown up in the air. It's height is given by h(t) = -5t2 + 23t + 2, where h(t) is in meters and t is in seconds. Use technology to answer: a.) What is the max height of the tennis ball? When does it occur? b.) How long was the tennis ball in the air?arrow_forward
- Help, I think the answer is the 5th choice, but I am not sure.arrow_forwardThe Beretta Model 92S (the standard-issue U.S. army pistol) has a barrel 127 mmmm long. The bullets leave this barrel with a muzzle velocity of 349 m/sm/s. 1) What is the acceleration of the bullet while it is in the barrel, assuming it to be constant? Express your answer in meters per second squared. 2) What is the acceleration of the bullet while it is in the barrel, assuming it to be constant? Express your answer as a multiple of acceleration due to gravity g. 3) For how long is the bullet in the barrel? Express your answer in seconds.arrow_forwardHow many significant figures does each of the following numbers have?a. 6.21 b. 62.1c. 0.620 d. 0.062arrow_forward
arrow_back_ios
SEE MORE QUESTIONS
arrow_forward_ios